What is a pressure loss?
In an air network (ventilation ducts, smoke control, process air) as in a water network (chilled water, heating, industrial fluids), the fluid loses pressure as it flows. This pressure drop, the pressure loss, is exactly the energy the fan or the pump must supply to maintain the flow rate.
The essentials. Every metre of duct and every singularity takes pressure from the fluid. That levy is paid directly in electricity: it sets the power, and therefore the consumption, of the fans and pumps. EOLIOS rebuilds the digital twin of the network, solves the flow by CFD and quantifies the pressure loss item by item, on air as on water. The goal: to size the fans and pumps of complex networks as tightly as possible, reduce their energy cost and reshape the ducts to remove avoidable losses.
It is the total pressure drop a fluid undergoes as it flows through a network. It is measured in pascals (air) or metres of fluid column (water) and sets the operating point of the fan or pump: the higher it is, the more energy must be supplied, and the higher the consumption.
A direct matter of consumption and sizing
The total pressure loss of a network determines the operating point of the machines that move the fluid through it. An over-resistant network calls for more powerful fans and pumps, which consume more throughout their life and age faster. Conversely, a controlled pressure loss makes it possible to choose more frugal machines, running at a lower and quieter regime.
On complex networks, heavily branched or congested, estimation from charts quickly reaches its limits: interactions between branches, closely spaced singularities and flow imbalances distort the calculation. CFD simulation lifts this uncertainty and makes it possible to size the fan or the pump as tightly as possible, without the costly safety margin added out of caution when the real pressure loss is unknown.
| Network | Fluid & machine | Examples | Typical issues |
|---|---|---|---|
| Air | Air · fans | HVAC ducts, smoke control, process air, chimneys | Consumption, noise, flow balancing |
| Water | Water or fluids · pumps | Chilled water, heating, industrial loops | Consumption, cavitation, branch balancing |
Study
- Design, analysis, optimisation
- Velocity and pressure distribution
- Steady or transient regime
Size
- Fans and pumps as tightly as possible
- Ducts, sections and singularities
- Balancing of complex networks
Advise
- Air and water networks
- Reduction of energy costs
- International projects
Linear losses and singular losses
A pressure loss always breaks down into two families, whether air or water. Telling them apart is understanding where to act to reduce a network's resistance.
Linear losses
They come from the continuous friction of the fluid on the walls. They grow with the length of the network, the viscosity of the fluid and the roughness of the pipes, and depend on the flow regime, characterised by the Reynolds number: laminar, transitional or turbulent. Each regime changes the balance of inertial and viscous forces, and therefore the way energy dissipates along the path.
Singular losses
They concentrate at the accidents of the path: bends, tees, valves, section changes, dampers, filters and heat exchangers. At these points the flow separates from the wall, accelerates and forms vortices that abruptly dissipate energy. In a real network, each singularity is characterised by its own loss coefficient, very sensitive to the exact geometry and to the proximity of the other accessories.
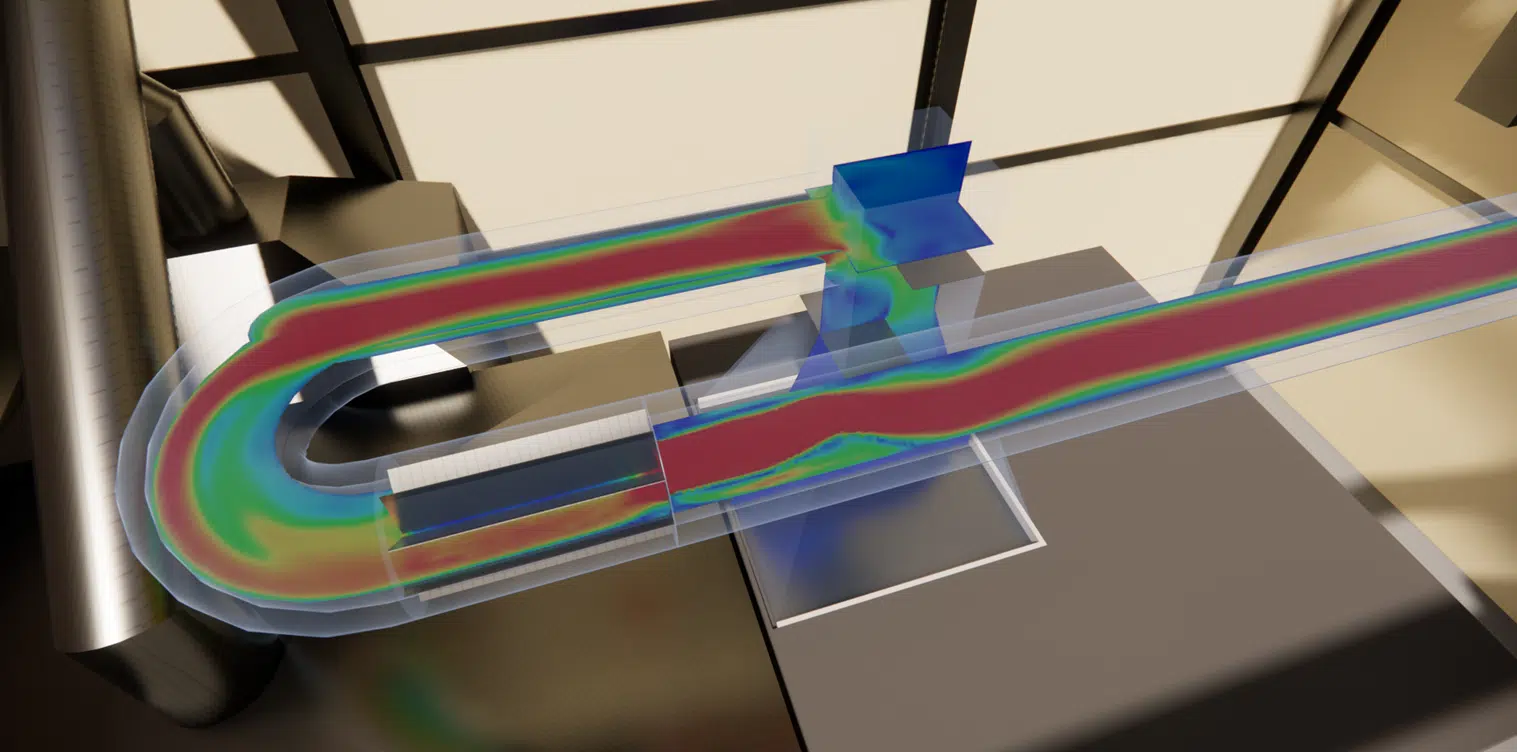
Left unmanaged, these disturbances complicate the assessment of losses and make the network less efficient and more costly to operate. They can also generate noise, vibration and flow imbalance between branches, as in the sizing of industrial chimneys, where pressure loss directly governs the draught. CFD simulation offers an exhaustive analysis of these phenomena and tailor-made solutions to maximise energy efficiency and extend the life of the installation.
The CFD digital twin of the network
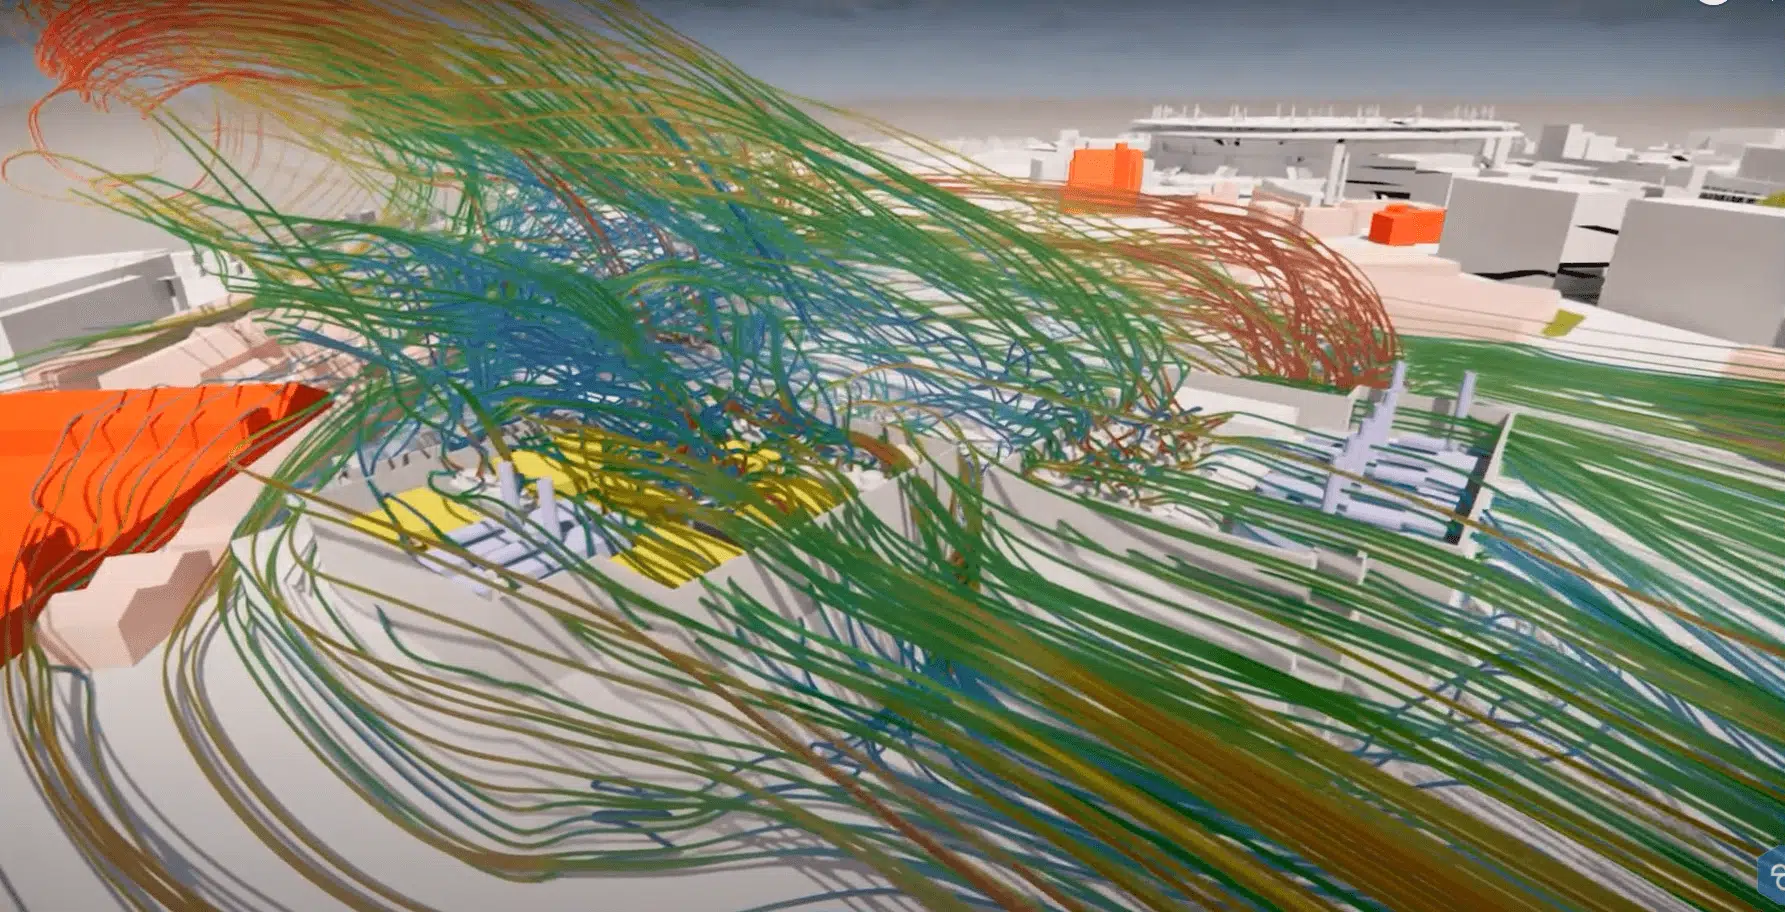
The complete geometry of the network and its singularities is rebuilt in three dimensions, then modelled by CFD simulation. This digital twin faithfully reproduces the behaviour of the fluid, where classic charts give only a global, approximate value.
The calculation steps
From the model to the pressure field
- 3D reconstruction of the network geometry, ducts and accessories included.
- Meshing of several million cells, refined along the walls.
- Boundary conditions : flow rates, pressures, inlet and outlet velocities.
- Resolution of the Navier-Stokes equations in each cell of the domain.
- Post-processing : pressure, velocity and fluid direction at every point.
Near the walls, the mesh is densified to resolve the velocity gradient finely. This precision, controlled by the y+ parameter, governs the fidelity of both the friction-loss calculation and the forces exerted on the surfaces.
The turbulence models k-ε or LES capture the influence of fluctuations on energy dissipation. Depending on the stakes, the study is run in steady regime, for one operating point, or transient, to follow the evolution of the fields over time. The result is a continuous, physically faithful picture of the flow, usable both for the loss calculation and for the wear analysis.
Results and network optimisation
What the simulation reveals
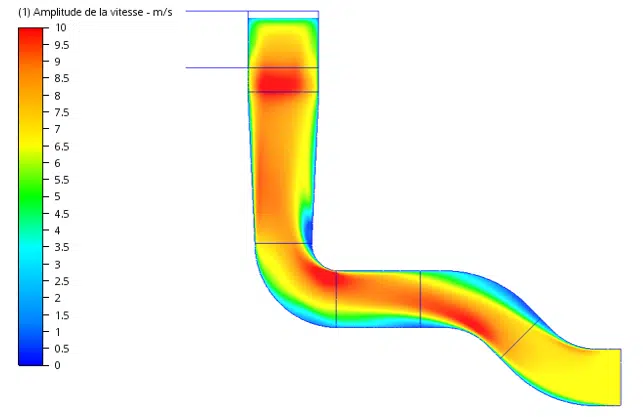
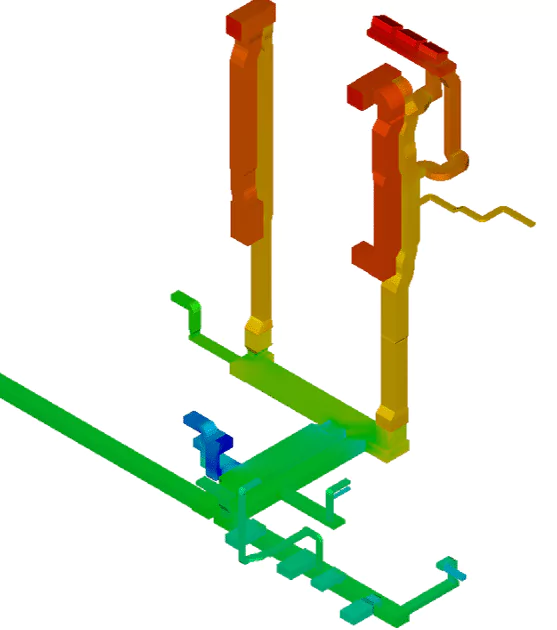
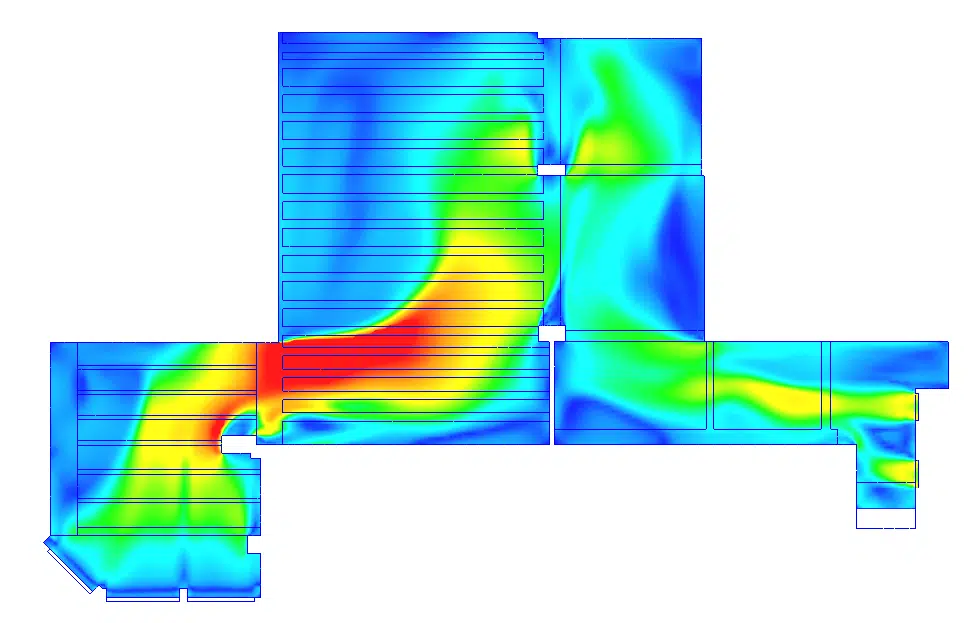
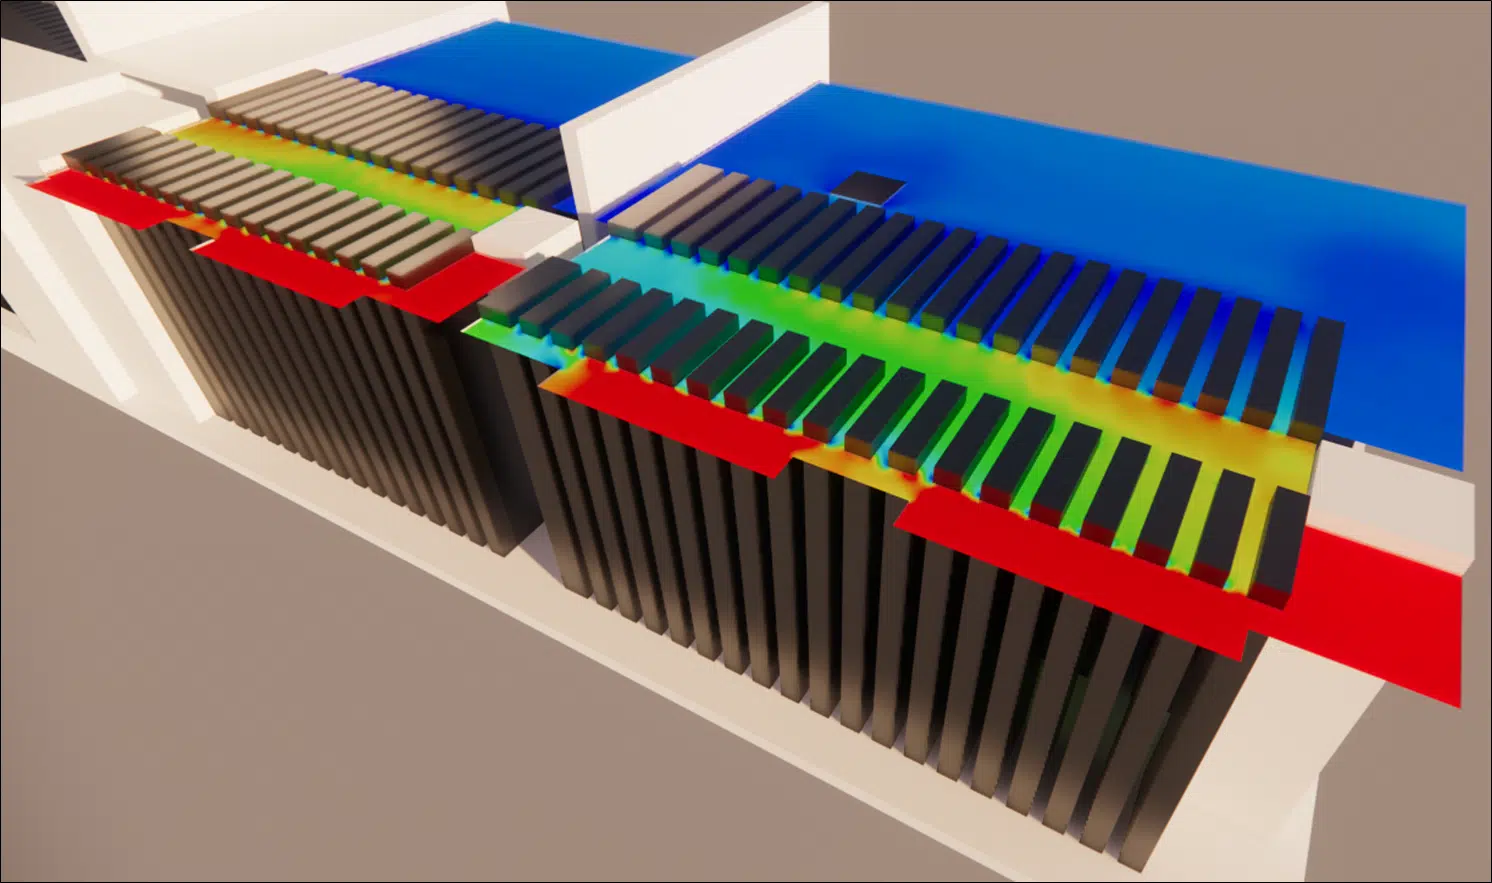
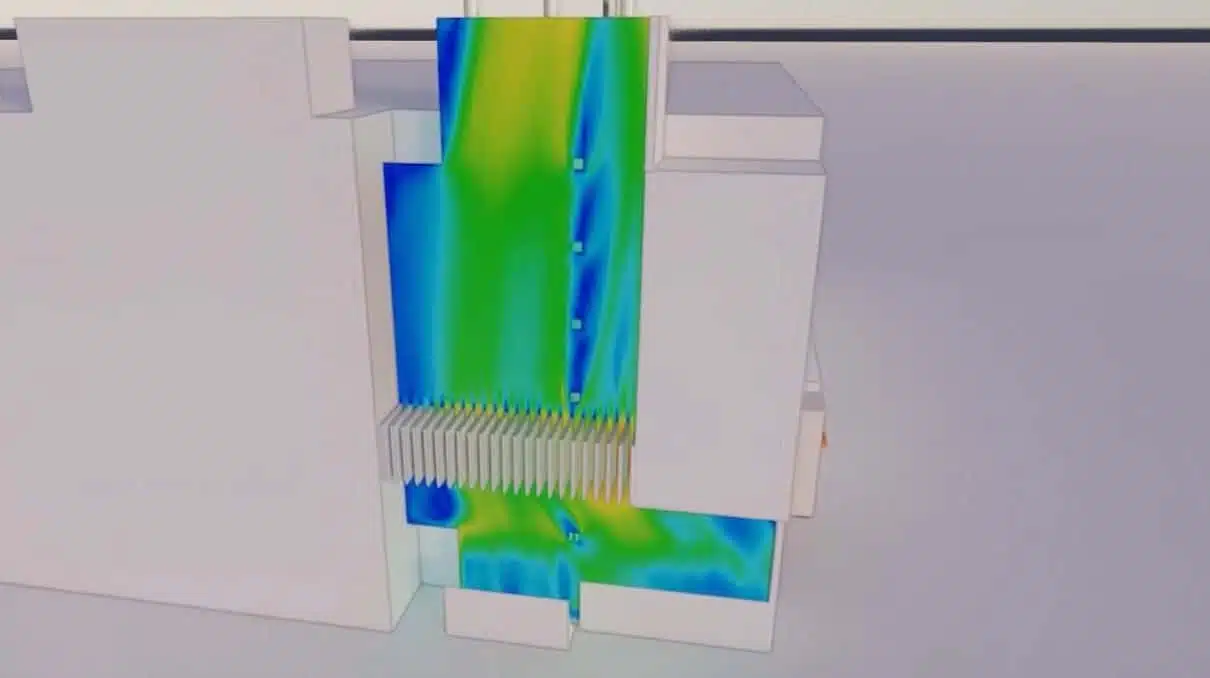
From this detailed picture, our engineers extract the pressure gradients upstream and downstream of each obstacle (the loss item by item), the velocity peaks and the vortices or dead zones that signal wasted volume and useless recirculation. This reading ranks the singularities to be treated first, those that weigh most heavily on the energy balance.
“Is your fan compensating for losses that simulation could have removed?”
Optimisation then acts on geometry and materials: softening a bend, widening a section transition, removing a redundant singularity or choosing a smoother wall. Each variant is replayed in the digital twin to measure its gain before any investment, which secures both design and renovation decisions.
Sizing of fans and pumps
The total pressure loss of a network is not just an indicator: it is the figure that commands the choice of machine. Fan on the air side, pump on the water side, it is what sets the power to install and, with it, the installation's consumption over its whole life.
The operating point
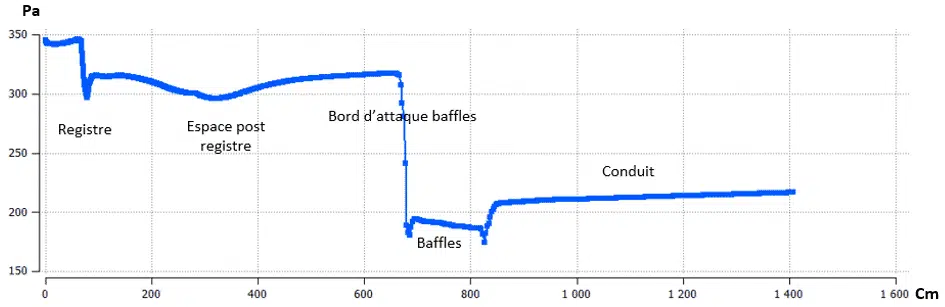
A network is characterised by its resistance curve: the pressure to overcome rises with the flow rate. The machine, for its part, follows its own characteristic curve. Their intersection defines the operating point, the flow-pressure pair at which the installation will actually work. Misjudging the pressure loss means getting the operating point wrong, and therefore the machine.
Intersection between the network's resistance curve and the characteristic curve of the fan or pump. It determines the real flow and pressure, as well as the machine's efficiency at that regime: the whole point is to place it where efficiency is highest.
Selecting as tightly as possible, above all on complex networks
By computing the real pressure loss of each section, the simulation makes it possible to select the machine at its best efficiency rather than oversize it as a precaution. On a complex, heavily branched network, it also checks the balancing of flows between branches and anticipates the effect of dampers and variable-speed drives, as on the exhaust and ventilation networks of generator sets. The result: a more frugal machine, a lower regime, less noise and a reduced energy bill over the whole life.
Oversizing costs twice. An over-powerful machine costs more to buy, then over-consumes constantly by running far from its optimal efficiency. Correct sizing, guided by the simulated pressure loss, avoids both of these extra costs.
Pressure-loss calculation of complex HVAC and smoke-control networks
HVAC networks (heating, ventilation, air conditioning) and smoke-control networks are among the most delicate to size: long branched ducts, multiple grilles and dampers, closely spaced bends and integration constraints within the building. On these complex networks, the sum of singular losses and the interaction between branches make chart-based calculation unreliable.
HVAC networks with sensitive balancing
In HVAC, pressure loss governs at once the choice of fans, the balancing of flows between rooms and acoustic comfort. The CFD calculation restores the pressure and velocity in each section, reveals under-supplied branches and makes it possible to adjust sections, dampers and geometries to guarantee the required flow at the grille, at the best efficiency.
Smoke control, where performance is vital
In smoke control, mastering pressure loss is a matter of safety: the network must extract a regulatory smoke flow despite long, bent ducts. The pressure-loss calculation checks that the extraction fans hold their operating point in a fire situation and sizes the ducts to reach the required performance.
On a complex network, the safety margin is calculated, not guessed
Oversizing an HVAC network wastes energy; undersizing a smoke-control network puts safety at stake. In both cases, only a faithful pressure-loss calculation makes it possible to size as tightly as possible.
The erosion study: identifying impact zones
A fluid laden with particles (dust, sand, droplets) does not wear the network evenly: wear concentrates where the particles strike the wall, at bends and singularities. Identifying these impact zones means knowing where the network will pierce first, and acting before the leak.
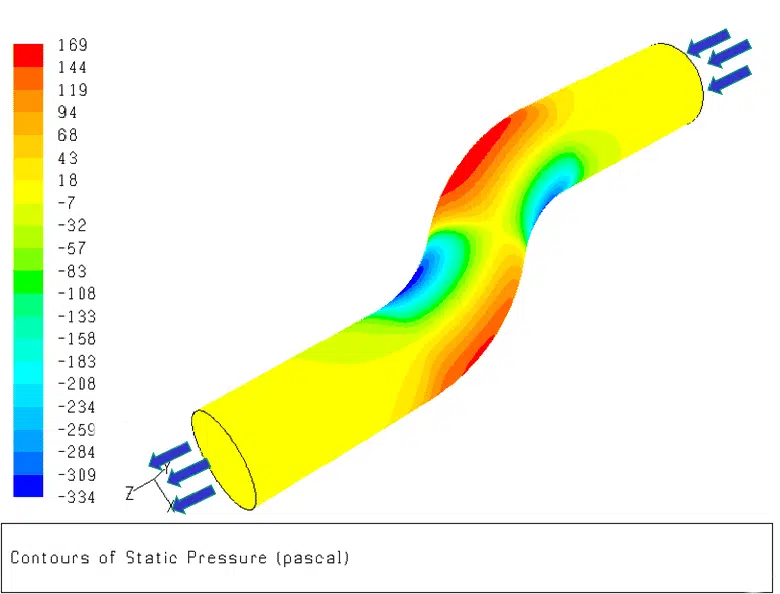
Progressive removal of material from the internal walls caused by the repeated impact of particles carried by the fluid. Its rate depends on the angle and velocity of impact as much as on the material, and sometimes combines with cavitation in water networks.
Mapping impacts by particle tracking
To the flow calculation, EOLIOS adds a Lagrangian particle tracking: representative particles (size, density, concentration) are injected into the fluid and the angle and energy of their impacts are counted wall by wall. From this a wear-rate map is derived, consistent with the standardised erosion models used in industry.
This mapping ranks the zones to protect and guides design choices: locally increasing thickness, applying an anti-abrasion coating, or above all revising the geometry that concentrates the impacts. It also makes it possible to predict the life of the most exposed components and to plan their replacement before the incident.
Wear is not proportional to velocity
It grows much faster: a modest local over-speed is enough to make a tight bend the first piercing point of the network. Softening its geometry reduces, in one gesture, both the singular pressure loss and the erosion, two gains for a single change.
Stagnation zones and dust deposit
Opposite the impact zones, some regions of the network see the velocity collapse: dead zones, recirculation, duct bottoms, lightly used branches. It is there that the suspended particles, no longer carried along, settle and progressively clog the installation.
Region where the flow slows or recirculates without renewing the fluid. Dust and particles sediment there, reducing the useful section, degrading performance and posing, in air networks, an issue of hygiene and fouling.
Anticipating fouling from the design stage
The simulation maps the low-velocity zones and predicts where deposit will accumulate. The route can then be redrawn to remove dead ends, the velocity revived in the affected branches, or cleaning access planned in the right places. In ventilation networks, this issue meets air quality and hygiene compliance; in water networks, it prevents clogging and loss of flow.
Impact zones and stagnation zones are the two complementary readings of the same simulation: the first tells where the network wears, the second where it clogs. Together they guide a more durable, frugal and easily maintained route over its whole life.
Impact zones · erosion
- Where : bends, restrictions, outer edges of direction changes.
- Mechanism : repeated high-speed particle impacts.
- Risk : wall thinning, leak, rupture.
Stagnation zones · deposit
- Where : dead zones, recirculation, duct bottoms.
- Mechanism : sedimentation of uncarried particles.
- Risk : fouling, loss of section, hygiene.
Our approach. EOLIOS does not stop at the calculation: each simulation leads to concrete recommendations and costed technical solutions, from resizing a fan to choosing a coating, by way of reworking a route. We quantify the problem, then propose and validate the optimisation in the digital twin before any implementation.