Wind, the blind spot of urban projects
A project can be perfectly designed on paper yet deliver an unusable forecourt: wind is the one outdoor-comfort parameter that appears on no site plan.
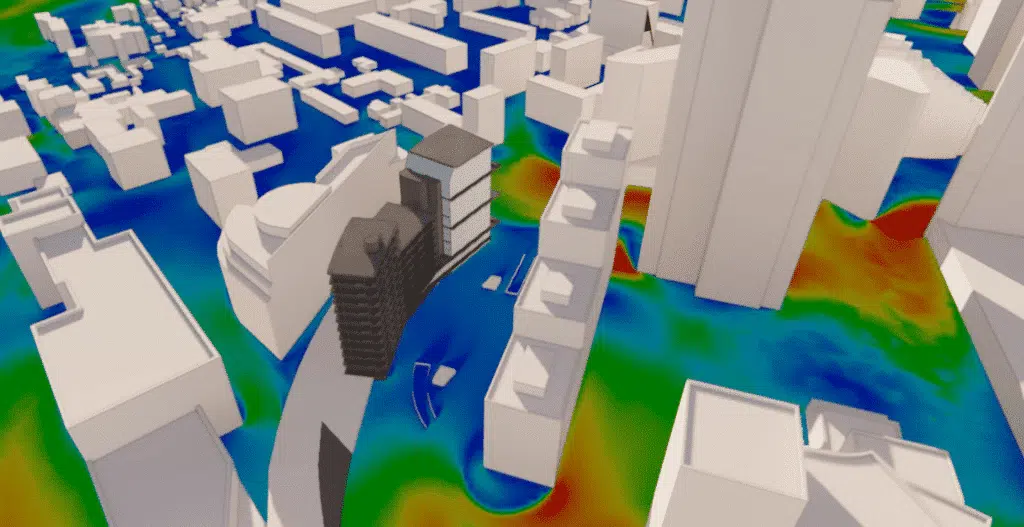
Every building reshapes the airflow far beyond its own plot. A tower captures fast high-altitude winds and sends them back to the ground; two closely spaced buildings compress the flow and speed it up; an open square becomes a corridor. At pedestrian scale, these phenomena translate very concretely: a hard-to-open entrance door, a deserted terrace, an unbalanced pushchair, a forecourt crossed at a run. It is this invisible path of the air that CFD simulation makes visible, before works begin.
What a site plan does not show
- Corner overspeeds. At building corners, the local speed can approach twice the incident wind; that is precisely where entrances are placed.
- High-rise downwash. The façade of a tall building deflects the fast high-altitude wind down to the ground: the foot of the tower receives the wind from the top.
- The Venturi effect. A narrow passage between two volumes concentrates the flow and turns a pedestrian link into a wind tunnel.
- Wakes and recirculations. Behind a massive volume, the air swirls: an apparently sheltered space can receive gusts from changing directions.
- Exposed uses. Terraces, rooftops, schoolyards and forecourts are judged on the felt wind, not on the district's average weather.
The stake is also economic. A ground-floor retail unit with a windy forecourt lets less well; an unusable terrace is a programmed area that produces nothing; a deserted public space is a lost development investment. The wind-comfort study secures the usability value of these outdoor surfaces, just as a structural study secures the building.
Comfort is decided 1.5 m above the ground
Comfort criteria are assessed at head height, crossing the felt speed with its frequency of occurrence over the year. A zone can be calm 90% of the time and still be unusable: it is the statistics of the wind, not its averages, that deliver the verdict.
What the wind does to a city
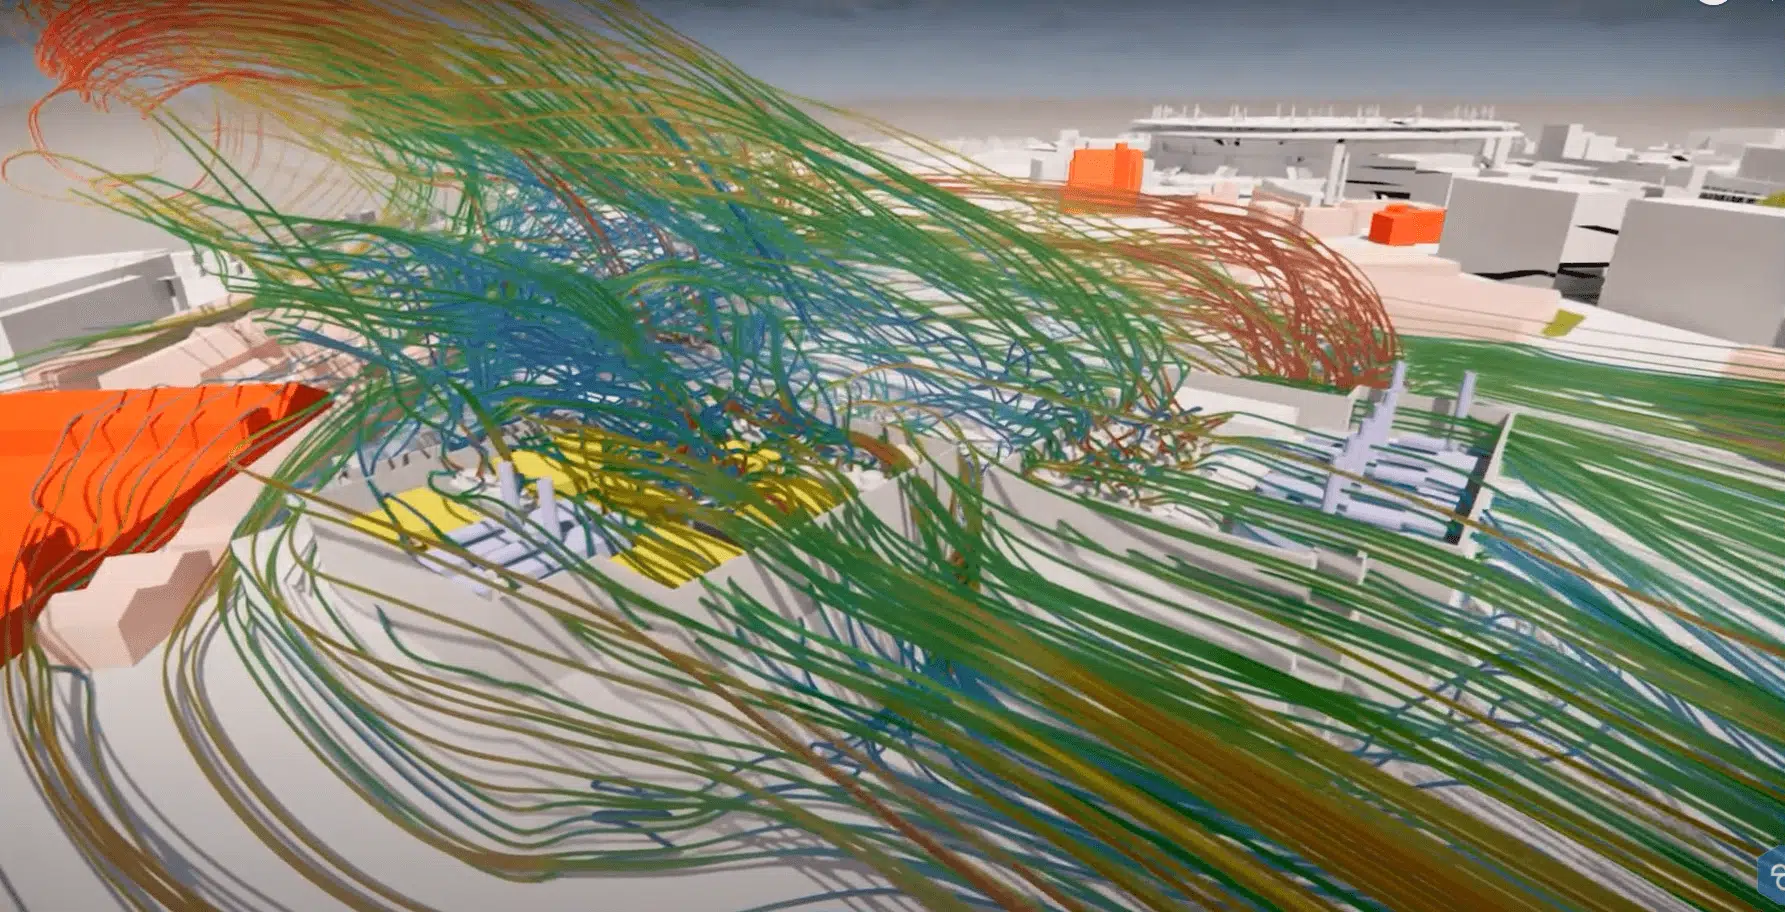
Urban wind is not a uniform flow slowed by buildings: it is a system of accelerations and recirculations governed by geometry. When it meets a façade, the air splits: part rounds the corners and accelerates, part plunges along the façade down to the ground, part rushes into the transverse streets. Every urban configuration produces its own aeraulic signature.
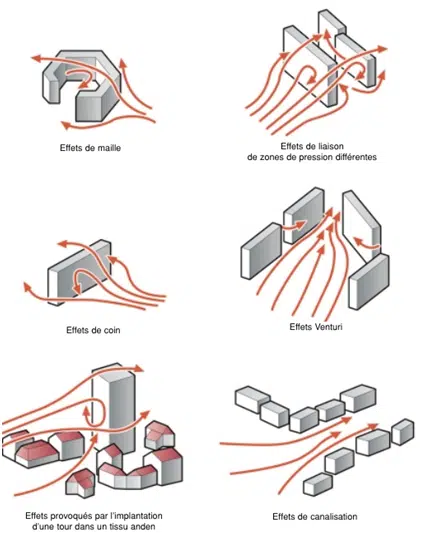
These mechanisms combine: a tower's downwash feeds a Venturi effect, which opens onto a square in a turbulent wake. The result: public squares turned into windy corridors, building entrances subject to sudden gusts, unusable terraces, and sometimes dangerous loads on glazed surfaces or lightweight structures.
Overspeed
- Local speed well above the incident wind, at corners, in passages and at the foot of high-rises. It creates the mechanical discomfort: hard walking, objects carried away, difficult doors.
Turbulence
- Gusts and wake vortices, unsteady by nature. A zone with a moderate mean speed can remain uncomfortable if the air constantly changes force and direction there.
When the flow is squeezed between two buildings, the airflow must be conserved through a reduced section: the speed rises. In the city, this effect turns passages, porches and pedestrian links into zones of chronic overspeed, often at the busiest points of the project.
How is wind comfort judged?
Wind comfort is not decreed, it is measured against standardised references. The most widely used is the Lawson criterion, complemented by the Dutch standard NEN 8100: both associate a wind speed and an admissible frequency of occurrence with each use. The more static the use, the stricter the requirement: more wind is tolerated on a transit pavement than on a café terrace.
| Zone use | Reference speed | Requirement | Example |
|---|---|---|---|
| Prolonged sitting | ≈ 4 m/s | The strictest | Restaurant terrace, public bench |
| Short sitting / standing | ≈ 6 m/s | Strict | Forecourt, bus stop, entrance |
| Strolling | ≈ 8 m/s | Moderate | Square, garden, pedestrian continuity |
| Brisk walking | ≈ 10 m/s | Tolerant | Transit pavement, link |
| Safety threshold | ≈ 15 m/s | Exceptional exceedance | All areas open to the public |
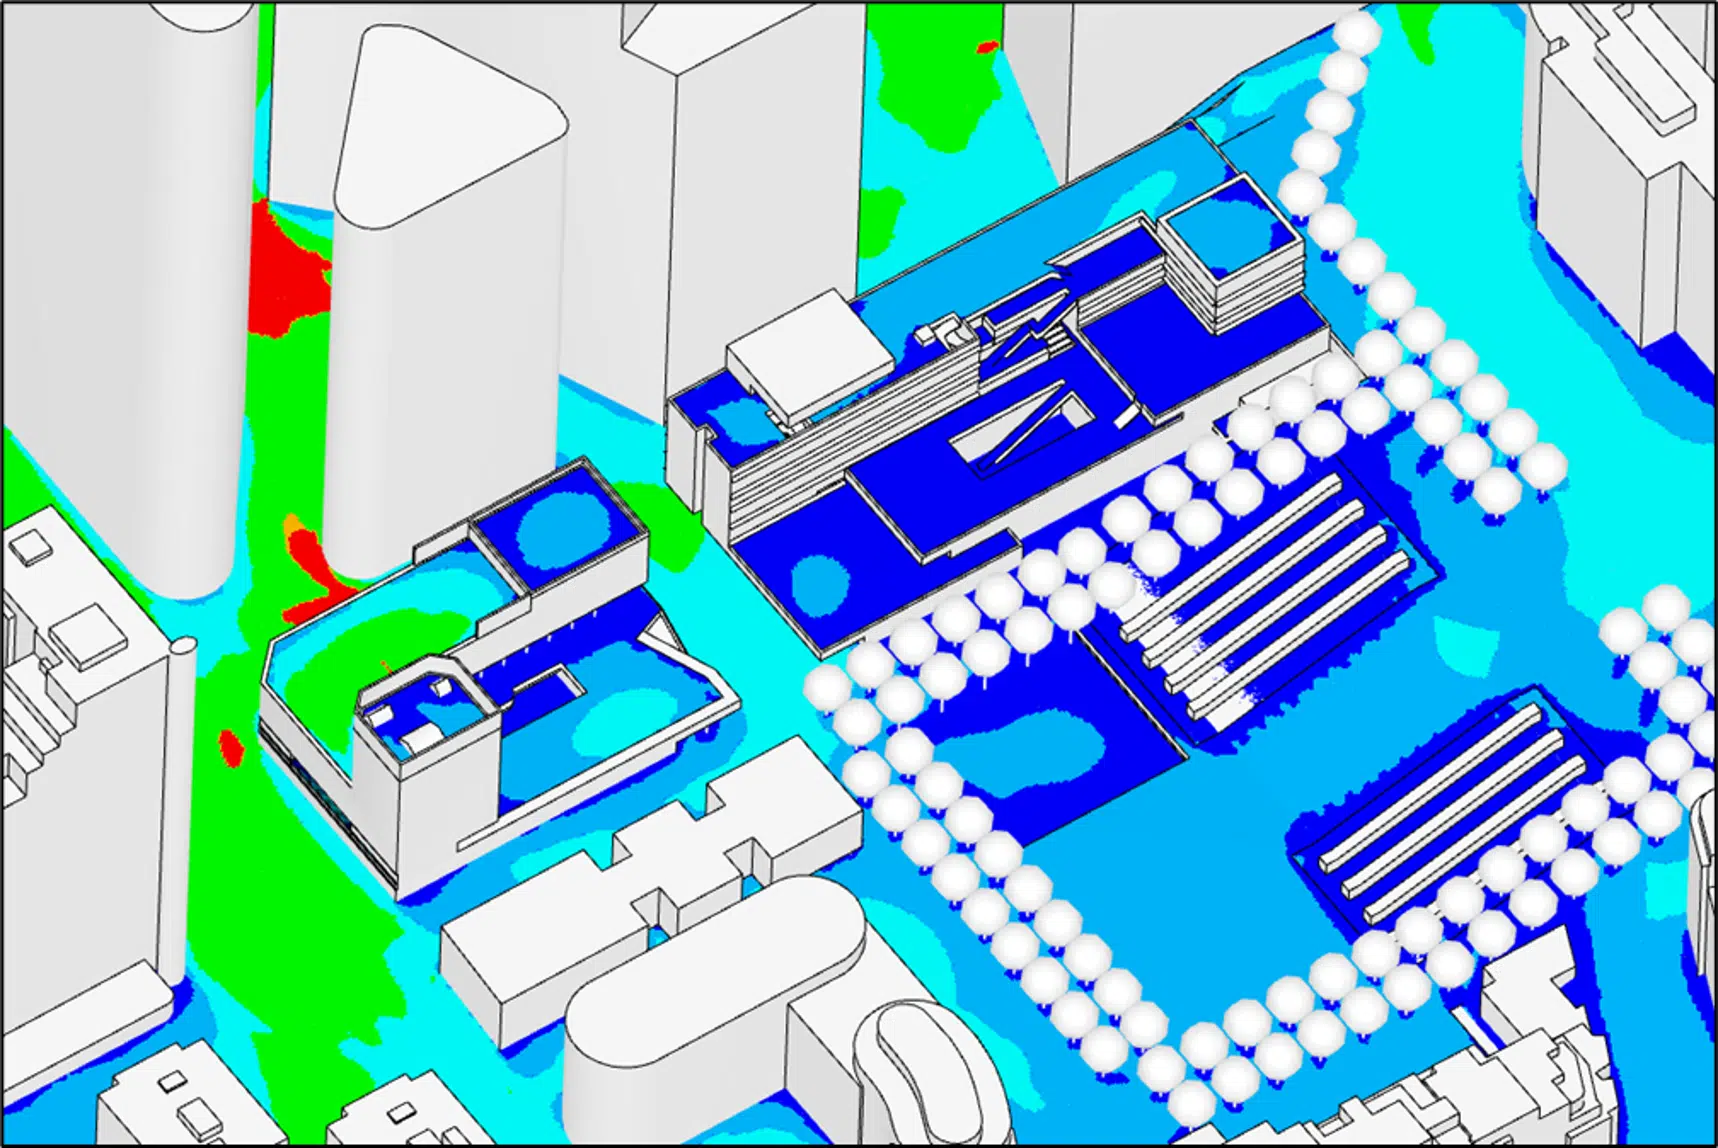
The final map crosses these thresholds with the local wind statistics: each point of the site receives the use class it can genuinely host. It is a programming tool as much as a verification tool: it says where to place the terrace, the play area or the entrance, and where protection will be needed.
A comfort criterion does not set a speed never to be exceeded: it sets a speed that must be exceeded only a small percentage of the time (typically 5% for comfort, far less for safety). It is this crossing of speed and frequency, computed from the site's wind statistics, that makes the comfort map robust and enforceable.
The choice of reference is made at kick-off, with the client and the inspection office where relevant: some tenders require Lawson, others NEN 8100, others a city criterion. Our maps are produced in the reference required by your file, and can be issued in several references for the same site.
The digital wind tunnel: what the model reconstructs
Our digital wind tunnel reproduces the site as it will be: the project geometry and that of its urban surroundings over several hundred metres, because it is the neighbouring buildings that condition the incident wind. The model is then exposed to the site's statistical winds, direction by direction, and returns the speed field at every point at pedestrian height.
The ingredients of the model
- The long-term wind rose. Statistics from the reference weather station: dominant directions, speeds, seasonal frequencies.
- The 3D model of the district. The project and its wider built context, the topography, the vegetation and its porosity.
- All the useful directions. Each significant wind sector is computed, then the results are aggregated into annual statistical maps.
- The analysis height. Fields are extracted 1.5 m above the ground, and at use height on balconies, terraces and rooftops.
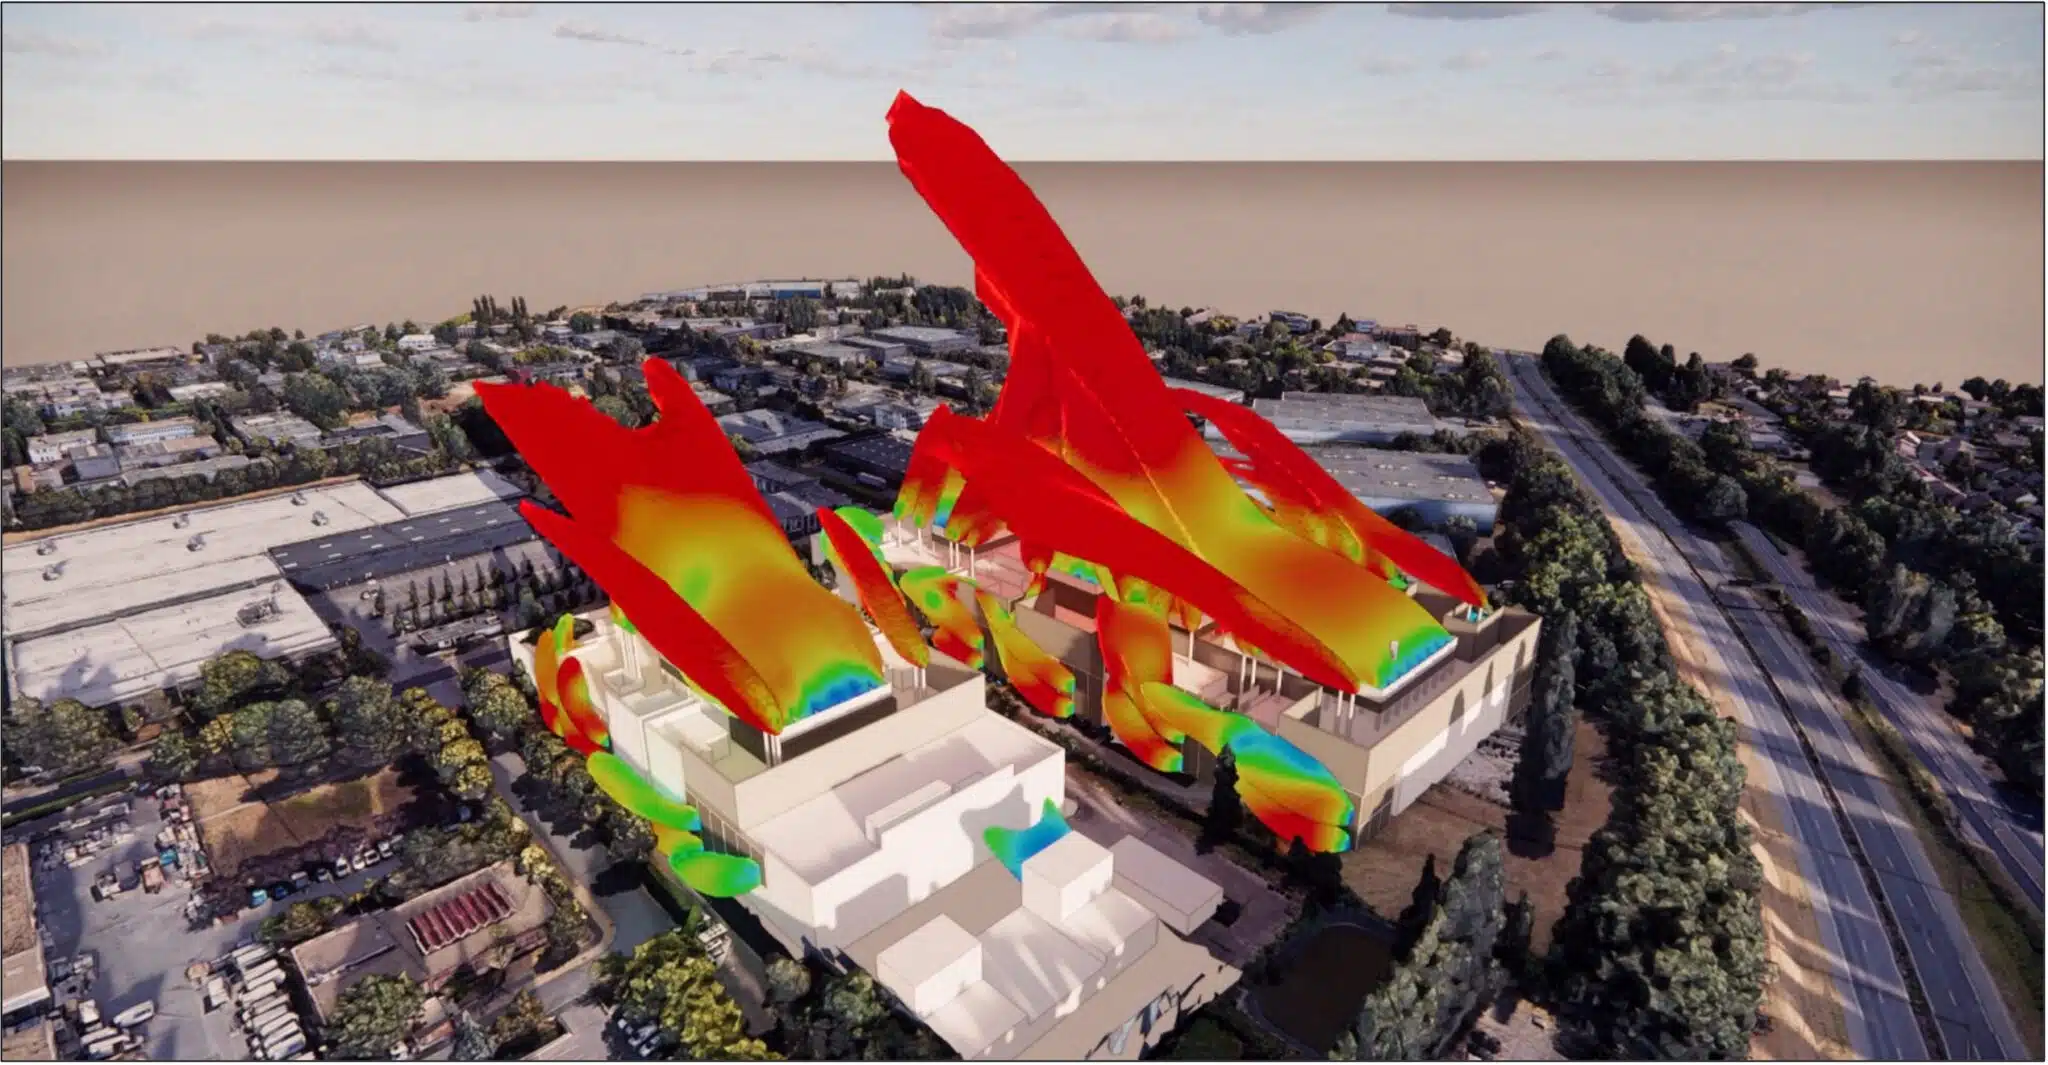
On the most sensitive sites, we bring in LES (Large Eddy Simulation): instead of averaging the turbulence, the computation resolves the gusts themselves. The wind is then seen living in the city, puff by puff, and instantaneous peaks are captured that an averaged approach underestimates. It is today the closest thing to a physical wind tunnel, with information at every point of the site.
“At a tower corner, the wind speed can approach twice the incident wind: that is exactly where the entrances are.”
The output is not limited to a mean map: we produce maps by wind direction (to understand which sector creates each discomfort zone), seasonal maps (a summer terrace is not judged on January storms) and vertical sections at the singular points, from the ground to the top of the towers. It is this granularity that then allows targeted protections to be designed rather than generic remedies.
The full approach follows a constant sequence: collection of climate data, construction and computation of the model, analysis of the speed fields, then translation into development recommendations, re-simulated until validation.
Long-term wind rose of the reference station, project drawings, district geometry, topography and vegetation.
3D model of the site and its surroundings, meshing, CFD computation of each significant wind direction.
Speed fields 1.5 m above the ground, statistical aggregation and crossing with the criteria (Lawson, NEN 8100).
Costed development recommendations, re-simulated until compliant, summary note for the file.
From diagnosis to corrected project
A comfort map only has value if it changes the project. Each hard spot identified (corner overspeed, Venturi, exposed terrace) is reworked with the design team and translated into testable solutions: windbreak screens and fences, canopies and overhangs, façade setbacks, vegetation sized for its porosity, or simply the relocation of sensitive uses. Each variant is re-simulated: we recommend only what works in the computation.
The typical questions the simulation settles
- Programming. Will this rooftop terrace really be usable, and in which seasons?
- Protection. What screen height, what hedge porosity, to shelter this forecourt without creating a troublesome wake?
- Layout. Is shifting the entrance a few metres enough to leave the overspeed zone?
- Trade-off. Between two massing variants, which offers the best wind comfort at equal cost?
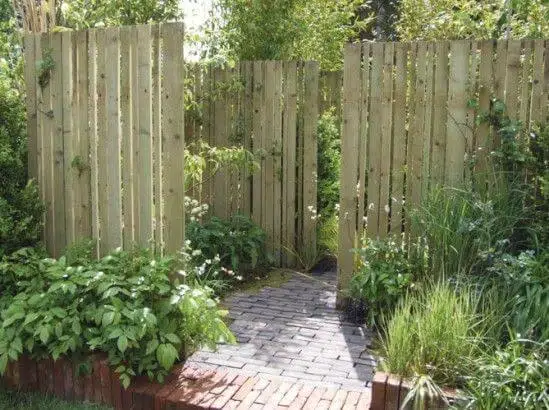
A well-sized windbreak fence channels the flow and creates a sheltered zone at use height, without generating troublesome wake turbulence downstream. The sizing (height, porosity, placement) is settled in the simulation, not by guesswork.
| Lever | Local effectiveness | Cost | Vigilance |
|---|---|---|---|
| Move the use (terrace, entrance) | Total | Near zero at sketch stage | Possible only in the early phase |
| Windbreak screen / fence | Strong | Moderate | Porosity to tune, downstream wake |
| Vegetation (hedges, trees) | Good, gradual | Moderate | Effect varies with season and growth |
| Façade canopy / overhang | Targeted | Moderate | Treats downwash, not the Venturi |
| Setback / recutting of volumes | Structural | High after permit | To arbitrate early, on simulated variants |
The same approach applies outside the dense city. In rural or peri-urban settings, the air circulates more freely: a summer breeze cools, but strong winds accentuate wind chill and erosion. The strategic placement of hedges, trees and natural barriers reduces the impact of gusts without compromising natural ventilation, taking account of seasonal variations and the terrain topography.
Sizing activities according to wind zones
The comfort map is not only a verification tool: it is a plan for programming uses. Each zone of the site receives a use class (prolonged sitting, standing, walking), and this class says very concretely what the space can sell: a restaurant terrace is only profitable on a "prolonged sitting" zone, a market or kiosks require a "standing" zone, a simple pedestrian link is content with a "walking" zone. Rather than placing activities on the site plan and then noting the problems, the programming is made to coincide with the real climate of the site.
What the comfort map helps to arbitrate
- Ground-floor retail. Positioning shopfronts, entrances and displays away from overspeed corridors: a threshold swept by gusts is customer flow that passes without stopping.
- Café and restaurant terraces. Delimiting the truly usable footprints, season by season, and sizing the protections (screens, pergolas) that extend the operating period.
- Squares and markets. Locating the seating zones, events and light installations (parasols, marquees) where the wind tolerates them.
- Balconies, loggias and rooftops. Checking from the design stage that these surfaces sold as outdoor spaces are really usable, and choosing between open balcony, sheltered loggia or windbreak balustrade according to the exposure of each façade and each floor.
This is a direct stake for property value: at equal area, a usable balcony, a terrace operated year-round or a welcoming building base let and sell better. On high-rises in particular, where exposure grows with height, the study determines floor by floor the type of outdoor space it is honest to promise.
More broadly, this reading opens onto an urbanism of wind: designing the city as a climatic environment whose uses are organised. Pedestrian routes take the calm zones, static activities concentrate in the sheltered pockets, ventilated corridors are preserved to cool and cleanse rather than be built over. Wind ceases to be a constraint endured and becomes a programming input, on a par with sunlight or noise.
Wind safety and regulatory files
Beyond comfort, the criteria set a distinct safety threshold: above about fifteen metres per second, a gust can unbalance a pedestrian, all the more so an elderly person, a child or a cyclist. The study identifies the zones where this threshold risks being crossed, particularly near high-rises, car-park exits and cycle continuities, and sizes the protections needed.
This analysis also has a file value. More and more local authorities expect a wind-comfort study at the permit stage for high-rise projects or large developments. Our maps, backed by the standardised references, fit into planning files and specifications; they extend naturally towards the calculation of wind pressures on façades per Eurocode 1 when the structure is at stake.
Orient the volumes, entrances and uses: each anomaly is corrected with a stroke of the pencil.
Ideal momentDocument the planning file with enforceable maps, in the required reference.
Size and validate the protections (screens, pergolas, vegetation) before they are installed.
Objectify an observed discomfort and arbitrate the remedies on a calibrated model of the real site.
Anticipating costs less than correcting
A wind pitfall discovered at delivery is treated with heavy corrective devices, often poorly integrated. The same anomaly detected at the sketch stage is resolved by a façade setback or a use relocation, at near-zero cost. That is the whole point of studying early.
Beyond wind: outdoor thermal comfort
Wind is only one of the components of comfort felt outdoors. The same simulation integrates, when the project requires it, sunlight and cast shadows, the radiant temperature of mineral surfaces and the humidity, to assess an overall outdoor thermal comfort: a forecourt sheltered from the wind but crushed by the sun stays uncomfortable in summer, and conversely a well-oriented breeze cools a mineral square.
This cross reading guides fine design trade-offs: orienting the resting spaces to catch the summer breeze and shelter from cold winter winds, positioning vegetation where it both cools and shelters, and checking that the dispersion of pollutants nearby (roads, ventilation outlets, loading docks) does not degrade the seating zones. It also prepares projects for future summers, where the passive cooling of public spaces becomes a design criterion in its own right.
Learn more: air pollution impact studyThe EOLIOS method: engineers who also do urbanism
For us, CFD is not a visualisation exercise: it is an urban design tool, placed in the hands of engineers who work daily with architects, landscapers and developers.
Rather than handing over a report, we optimise the project with the design teams. Each hard spot is reworked in workshops, translated into costed recommendations, re-simulated until a solution integrated into the architecture is reached. We intervene from sketch to permit, on business-district towers, schools, rooftops, sports facilities and public spaces, in France and internationally. The results take the form of images and 3D animations understandable by all the project stakeholders, usable in a design meeting as much as in a regulatory file.
This expertise does not work alone: it articulates with our other Air & Wind skills. The same district model feeds the calculation of wind pressures on façades for the structure and the glazing, the study of the dispersion of pollutants and odours nearby, and the analysis of heat islands. For a client, it is one model, several answers, and one point of contact.
The sequence of a study
- Kick-off. Planned uses, sensitive zones, file requirements; choice of the comfort reference.
- Data & model. Long-term wind statistics, geometry of the project and the surrounding district.
- Multi-direction computations. Simulation of each significant wind sector, LES on sensitive sites.
- Workshop & variants. Comfort maps, recommendations, re-simulation of the retained solutions.
What we deliver
- Maps of comfort by use (annual and seasonal) and maps by wind direction.
- Ranked identification of the discomfort and danger zones, with their mechanism (Venturi, downwash, corner).
- Costed development recommendations, validated by re-simulation.
- Images, 3D animations and a summary note that can be integrated into the planning file.