Wind study of buildings: why wind governs the structure
On a building, wind is not a surface nuisance: it is a mechanical action transmitted from the envelope down to the foundations, and it often governs the design of slender, lightweight or widely-spanned structures.
The action of wind on buildings is inherently three-dimensional, unsteady and strongly context-dependent. High winds generate aerodynamic loads liable to affect not only the load-bearing structure, but also the building envelope (curtain walls, glazing, cladding), the technical equipment, the fixing systems and the outdoor fittings.
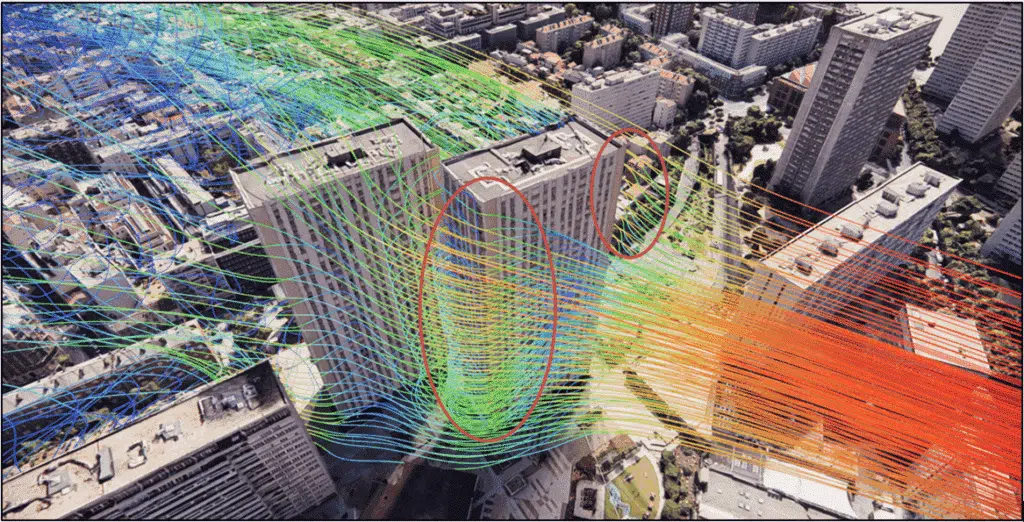
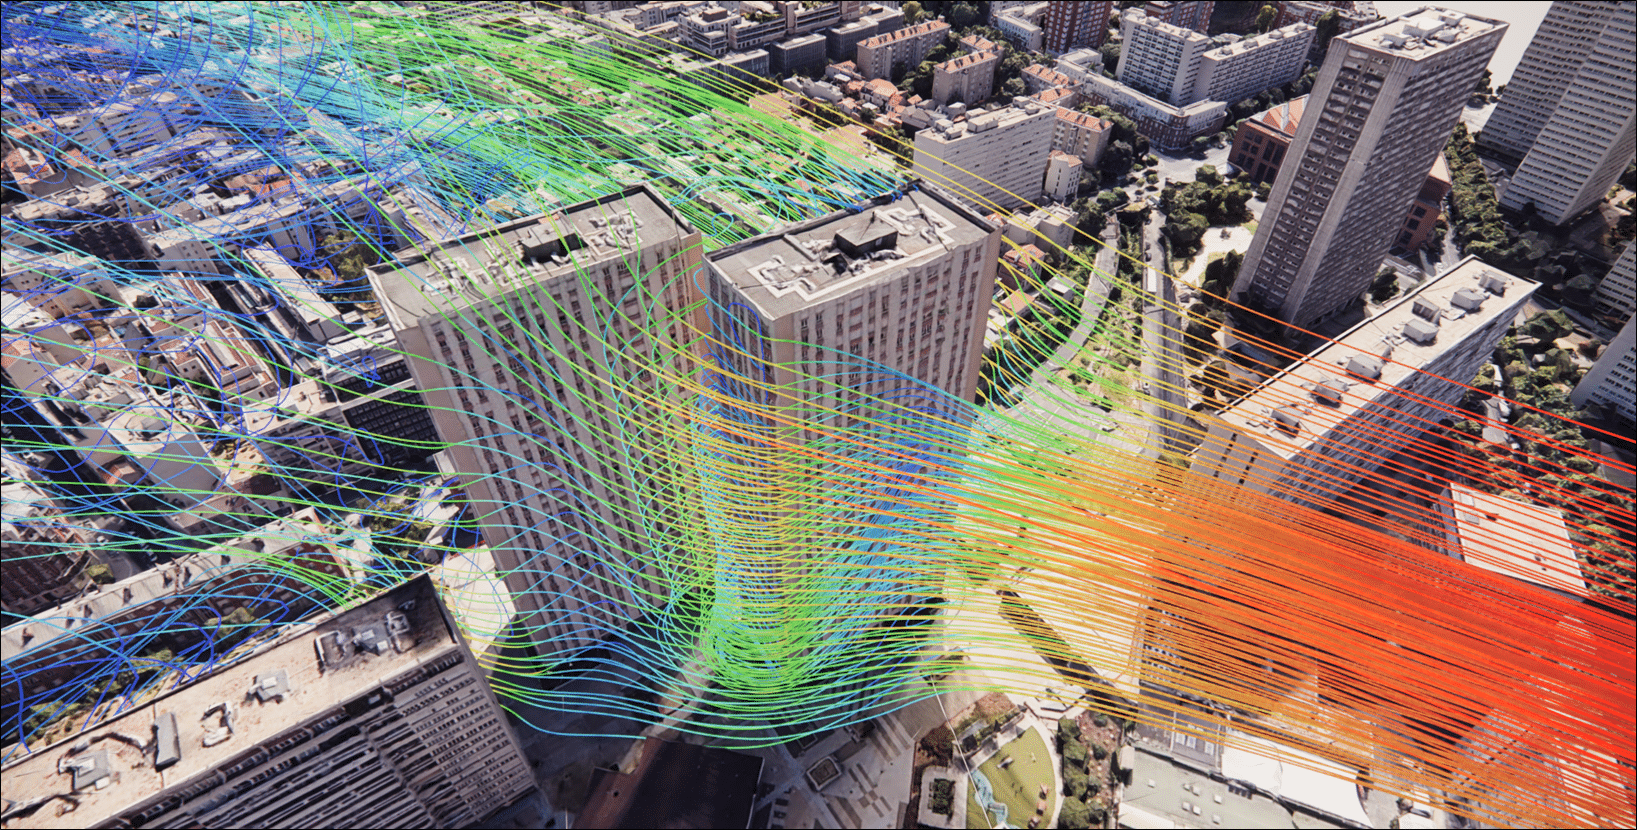
Beyond the global forces, it is the local effects that constitute the main risk factor. The combination of height, geometry (sharp corners, setbacks, complex roofs), the possible porosity of the façades and the immediate surroundings (obstacles, other buildings, terrain) generates advanced aerodynamic phenomena: intense overpressures and suctions, high pressure gradients, local wind accelerations, Venturi effects between built volumes, corner vortices and unstable recirculation zones.
These phenomena can lead to extreme loads on very localised zones, often poorly represented by global code-based methods. In dense urban environments, the interactions between buildings amplify these effects and make the wind assessment particularly sensitive to the calculation assumptions. A poor appraisal of these mechanisms can lead to:
What a poor appraisal of wind can cost
- Local under-sizing of façade or roof elements, invisible until the design wind actually occurs.
- Tear-off of technical equipment, roofing or waterproofing, endangering third parties.
- Risks to users in exposed pedestrian areas.
- Overall instability of lightweight, temporary or long-span structures.
- Premature deterioration of the works: fatigue of the fixings, progressive peeling, significant remediation costs.
Controlling the effects of wind is therefore a matter of safety, durability and economic control of the project. The scope covered by our studies is broad:
For many structures, wind is the governing variable action
On high-rise buildings, long-span roofs and lightweight structures, the wind-driven load combination frequently governs the ultimate limit state, ahead of snow or occupancy. The quality of the wind-load assessment therefore directly conditions the safety of the works and the cost of the structure.
Wind forces on a building: overall stability and local tear-off
Any serious wind study is built around a fundamental distinction, because it calls for neither the same methods, nor the same coefficients, nor the same checks. We separate the overall forces, which load the global structure and travel down to the foundations, from the local forces, which size the envelope, its attachments and its fixings.
Overall forces — the structure
- Global wind resultant: drag forces (along the wind) and lift (transverse and vertical).
- Check of the stability: overturning, sliding, global uplift of the works.
- Sizing of the bracing, the cores and the load path down to the foundations.
- Dynamic effects for flexible structures: resonance, vortex shedding, comfort at the tower top.
Local forces — the envelope
- Peak suctions at roof edges and corners, on parapets, verges and façade setbacks.
- Sizing of the fixings for roofing, waterproofing, cladding and rainscreen.
- Resistance of the glazing, panels and attached equipment exposed to uplift.
- Highly concentrated zones, often under-estimated when reasoning in mean values.
Tear-off is the suction force (negative pressure) that tends to peel an element off its supporting structure. On a flat roof, the conical vortices that form at the corners under oblique wind, as on the Cascades tower in Caen, create suctions that can exceed two to three times the reference dynamic pressure. It is this local value, and not the mean, that sizes the number, the type and the spacing of the fixings.
This reading grid drives the whole rest of the study. The overall forces are expressed as a wrench (resultant forces and moments) handed to the structural office for the stability checks; the local forces are expressed as pressure maps and extreme values per zone, used for the design of the envelope.
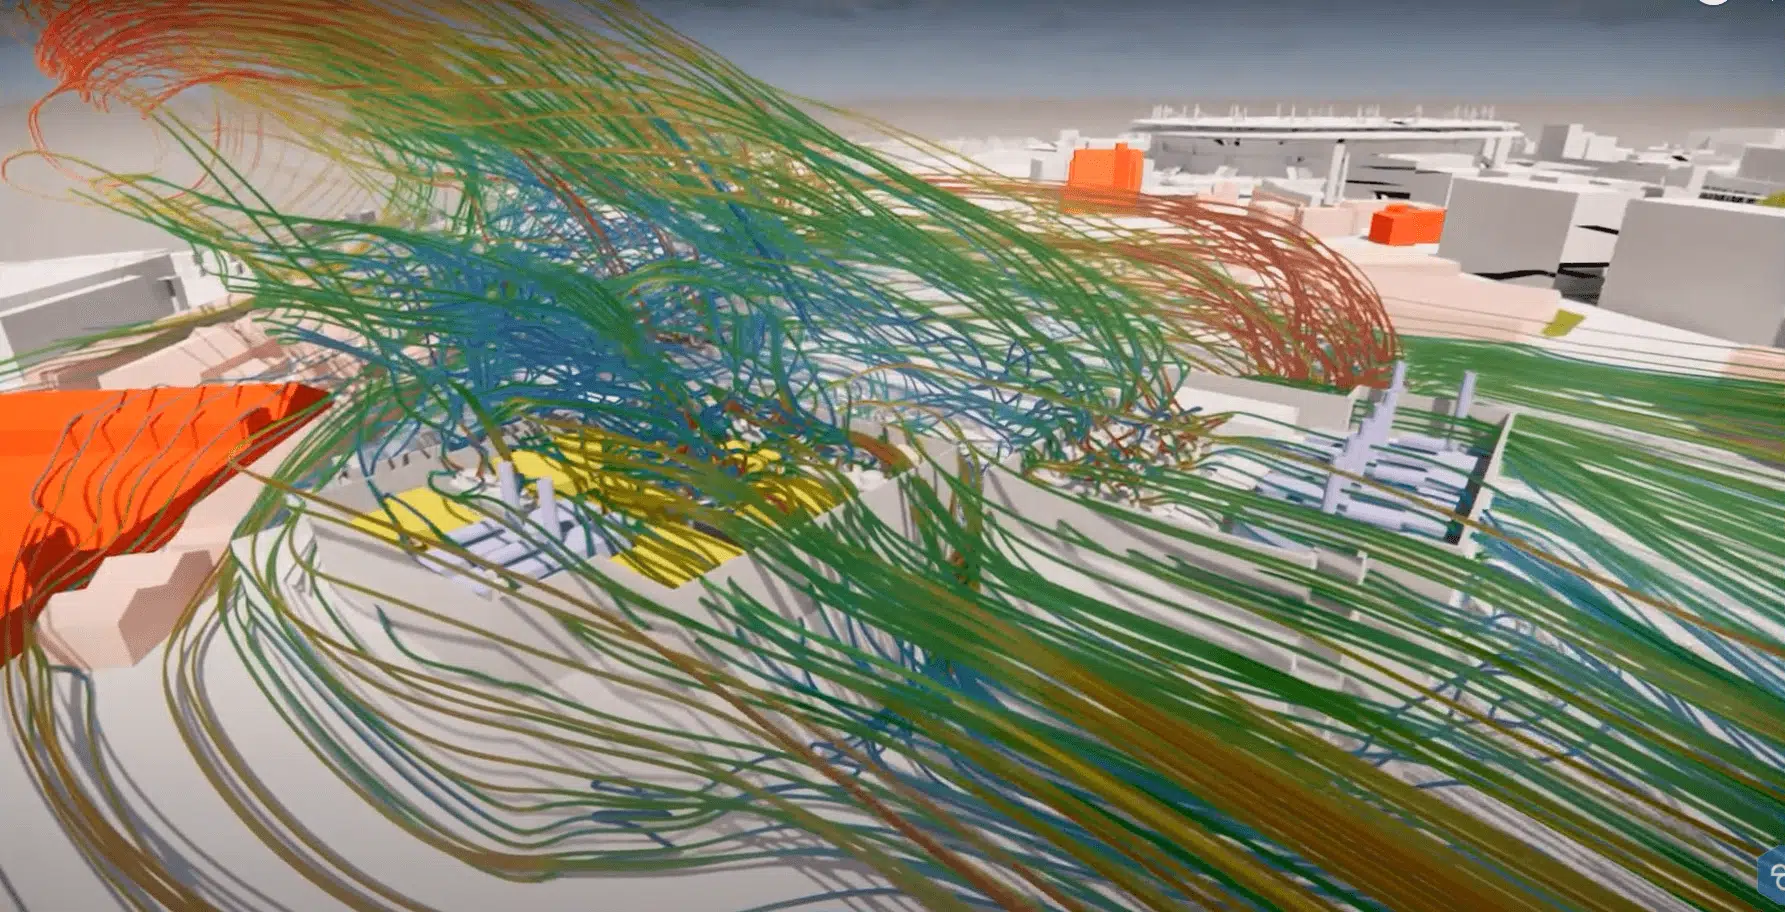
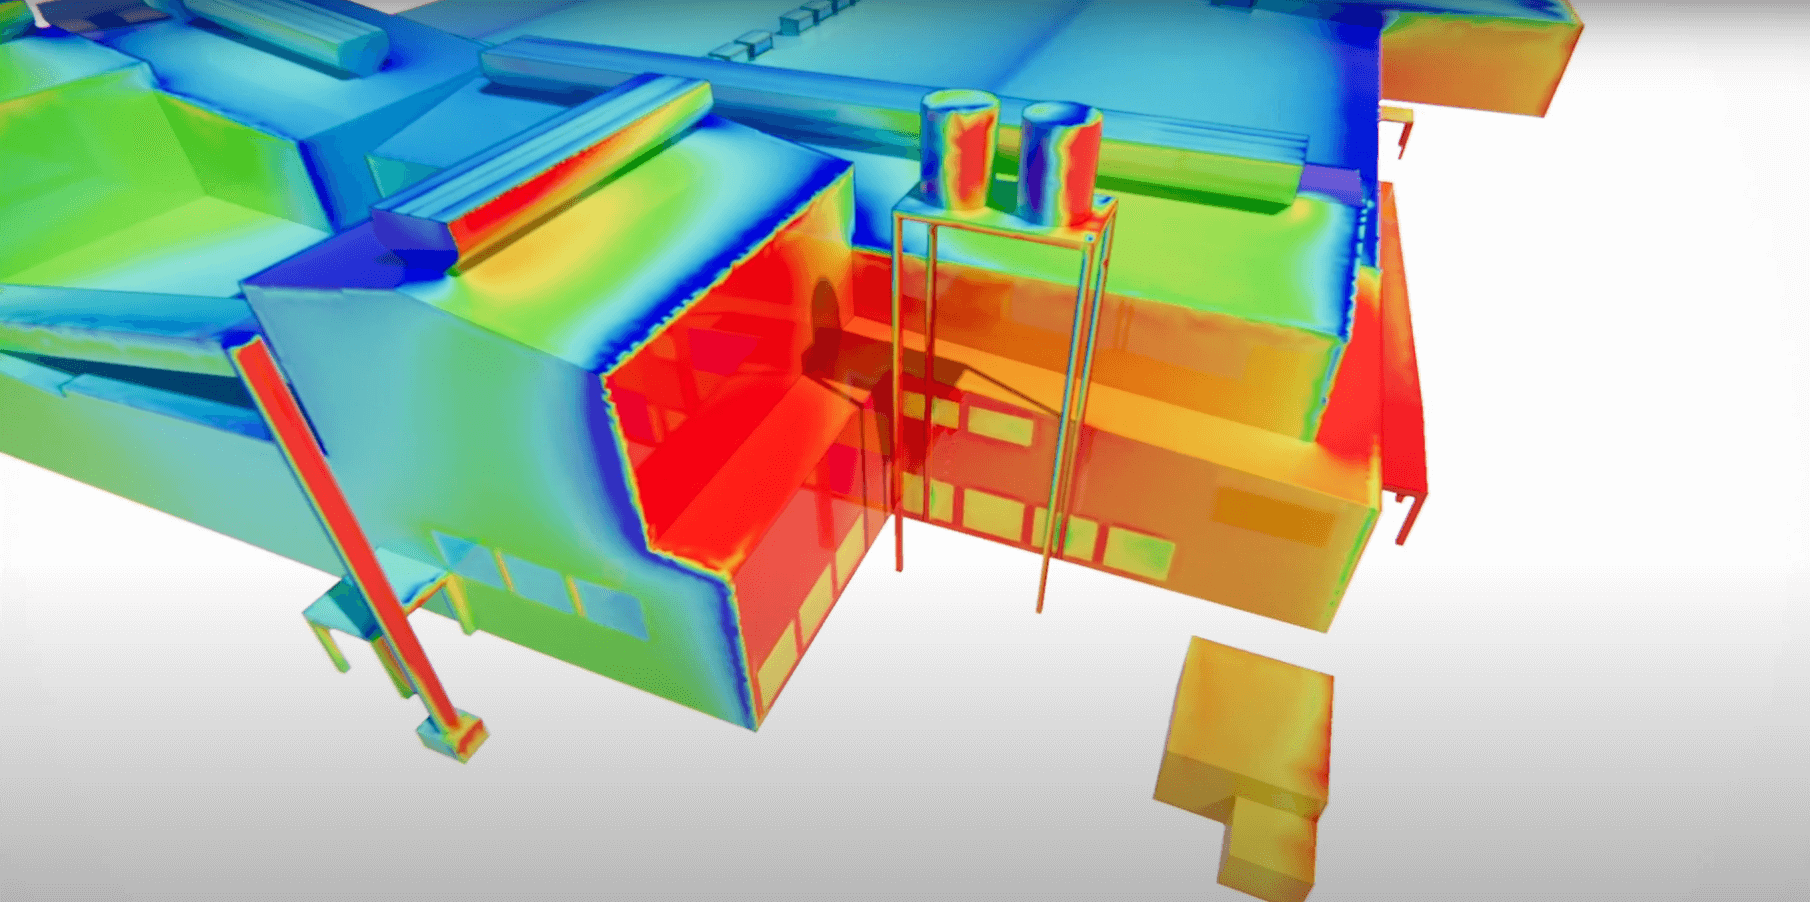
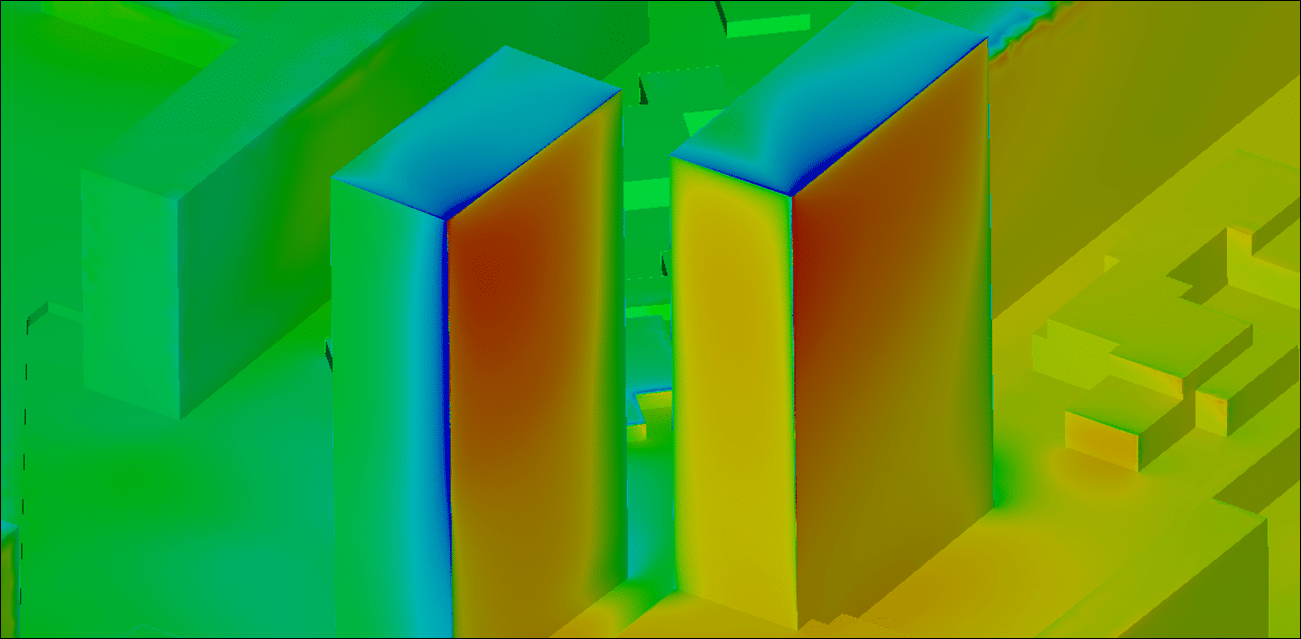
Unlike the mean-coefficient approaches, the simulation finely maps the pressures and suctions over all the walls, identifies the pressure peaks linked to corner and edge effects, analyses the local accelerations of the wind and the shear zones, and characterises the aerodynamic interactions between neighbouring buildings.
Cpe,1 is not Cpe,10. The Eurocode distinguishes the local coefficient Cpe,1 (loaded areas below 1 m², for fixings and small elements) from the overall coefficient Cpe,10 (areas of 10 m² and above). Confusing the two, or applying the overall value to a fixing, is one of the most common sizing errors.
Wind pressure calculation to Eurocode 1 (NF EN 1991-1-4)
EOLIOS studies fall strictly within the regulatory framework of Eurocode 1, wind actions (NF EN 1991-1-4) and its French National Annex. CFD is not used there as an alternative to the standards, but as a complementary, consistent and defensible tool. The logic of the standard is a chain of transformation: it starts from a reference meteorological wind, turns it into a site wind through roughness and orography, then into a peak pressure integrating the gusts, and finally into applied loads via the pressure coefficients. Each link has its parameters:
1. Reference wind speed: Eurocode zoning and coefficients
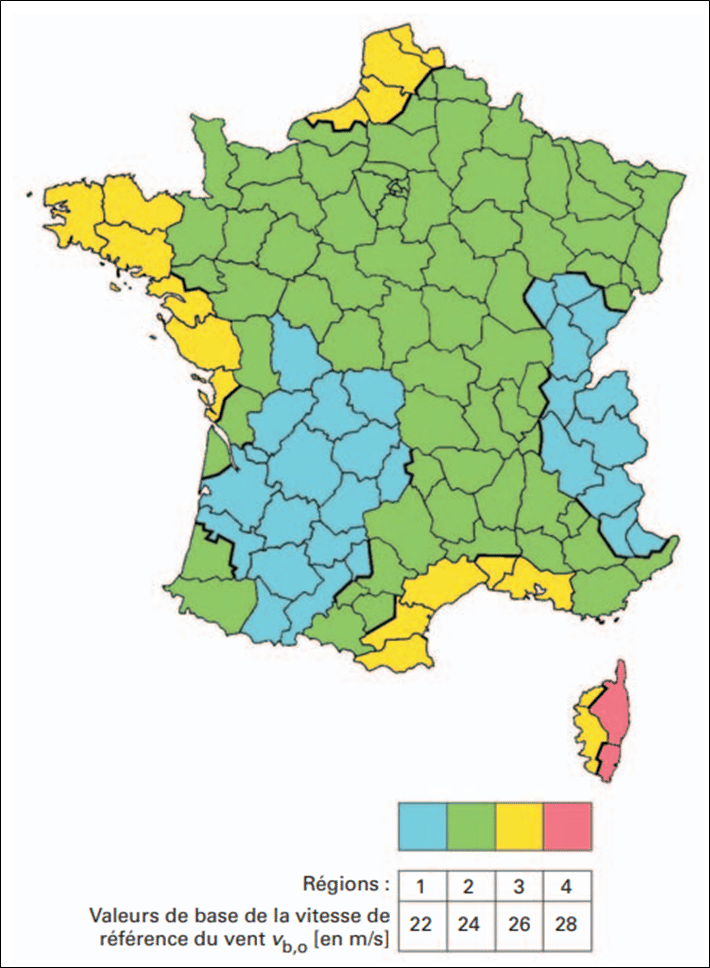
The basic speed vb,0 corresponds to an extreme but rare wind event (mean return period of about 50 years). It is defined over a 10-minute period, 10 m above the ground, in open countryside. Dependent on the geographical zone, it is set by the Eurocode zoning: mainland France is divided into 4 wind zones by the National Annex. Two coefficients then build the reference speed vb.
The directional factor cdir accounts for the fact that the strongest winds do not always blow from the most unfavourable direction: it reduces the reference speed when the critical orientations are unlikely. The seasonal factor cseason reflects the distribution of extreme winds over the year: it equals 1 (maximum) for permanent works and can be lowered for temporary works such as scaffolding.
2. Terrain categories and roughness: the wind velocity profile
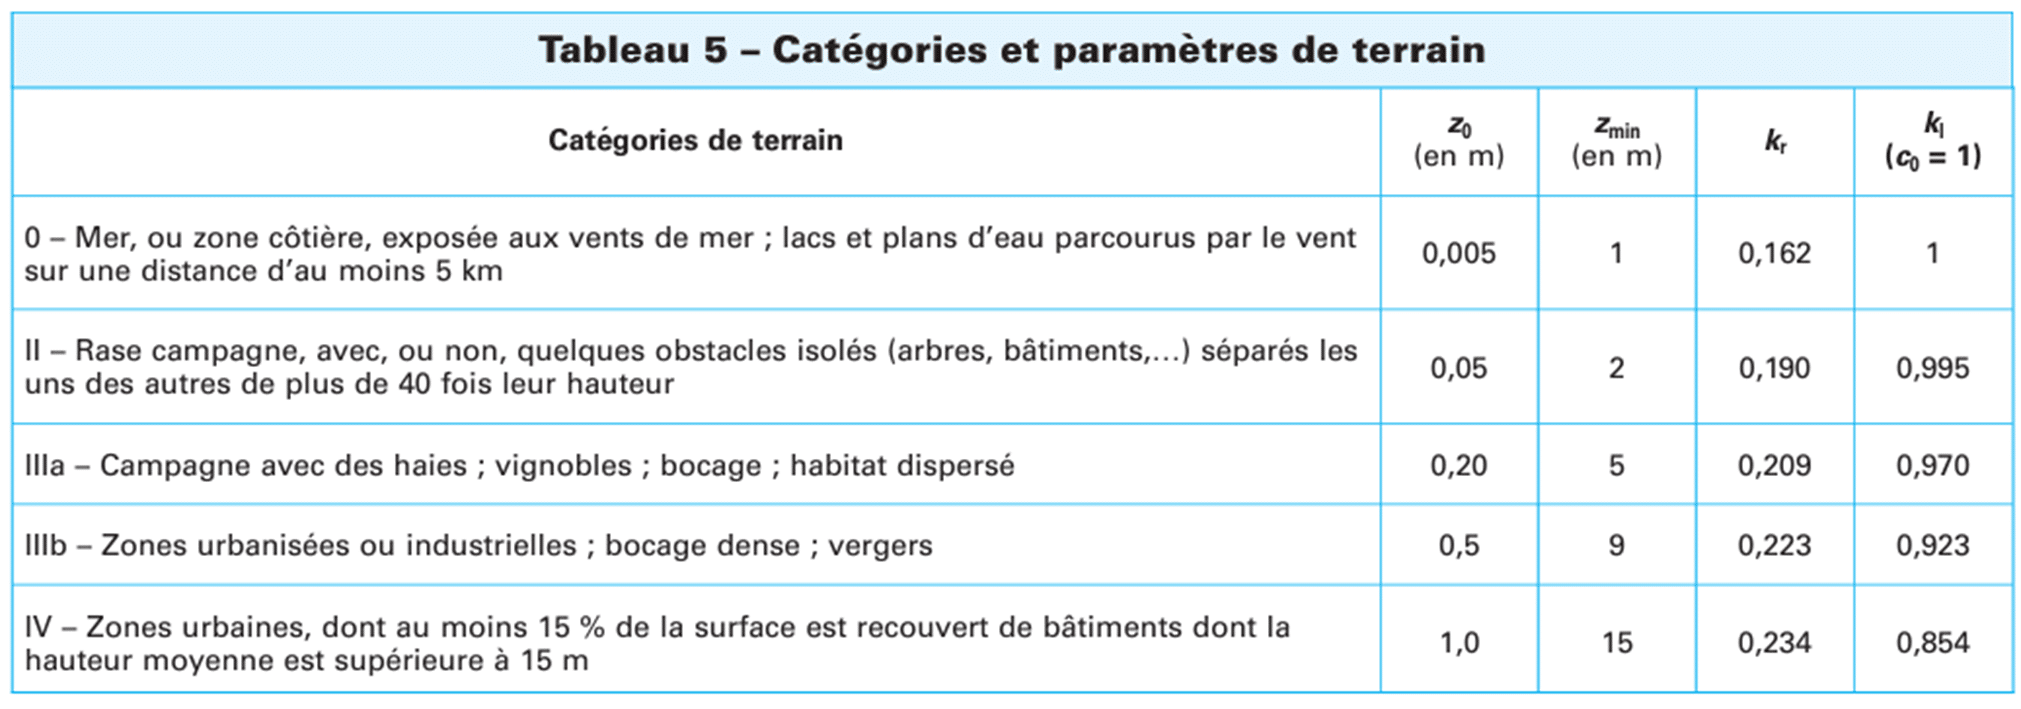
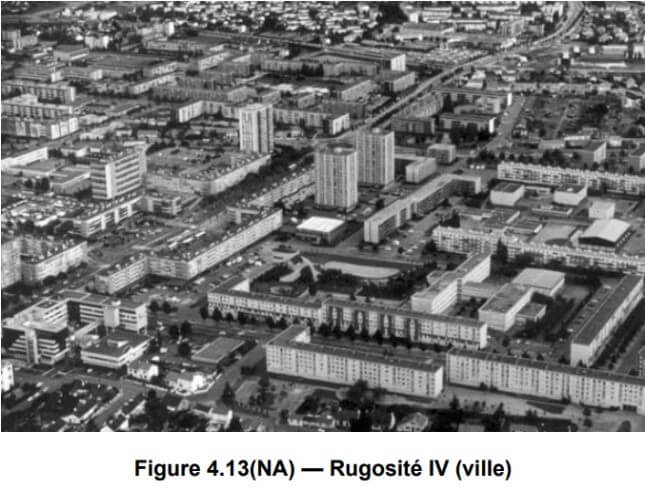
The reference wind is an open-country wind; the wind that actually hits the works depends on the terrain crossed. The National Annex tabulates the apparent roughness length z0 according to the nature of the site, in terrain categories 0 to IV. In urban studies, the roughness imposed corresponds to a category IV urban roughness: this is what conditions the wind velocity profile, a fundamental input for the inlet conditions of the CFD model.
The roughness factor cr(z) reflects the mean variation of speed with height. It involves z0, the lower validity limit zmin, the maximum height of the study zone zmax and the terrain factor kr:
3. Orography and mean wind speed vm(z)
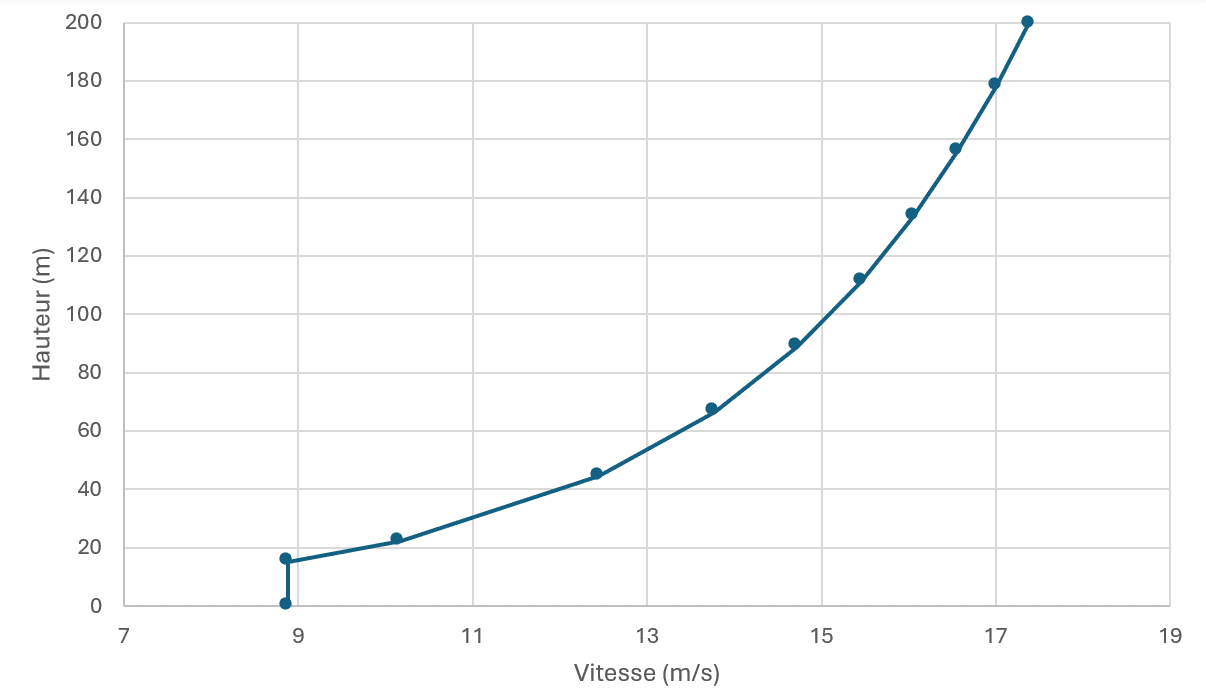
The orography factor c0(z) accounts for the influence of the terrain relief (hills, ridges, escarpments) on the wind speed: relief locally accelerates the flow and increases the site wind. Its effects may be neglected when the mean upwind slope is below 3°; c0(z) = 1 is then taken. The mean speed vm(z) combines the reference speed with the two coefficients; iterating the equation over height yields the logarithmic profile of the mean wind:
4. Peak dynamic pressure qp(z): the effect of gusts
Natural wind is not steady: it fluctuates in gusts whose relative intensity grows near the ground and over rough sites. The Eurocode captures this effect through the turbulence intensity Iv(z) and defines the peak dynamic pressure qp(z), which combines the mean and fluctuating parts of the pressure. It is the pivotal quantity of the whole standard: all the applied loads derive from it.
5. Cpe and Cpi pressure coefficients: from charts to wind loads
The pressure exerted on a wall is obtained by multiplying qp by a pressure coefficient reflecting the shape of the building and the position of the zone considered. The Eurocode tabulates in its charts the external coefficient Cpe by standardised zones (zones A to E on façades, F to I on roofs, the corner F zones being the most severe) and the internal coefficient Cpi, which depends on the permeability of the envelope and may add to the external suction. The net design load combines both:
The limits of the Eurocode calculation: an isolated building, with no surroundings
The Eurocode gives its coefficients from idealised geometries: isolated boxes, simple pitched roofs, homogeneous surroundings. This framework is robust, proven, and sufficient in most common cases. But it rests on two strong assumptions: that the shape of the project resembles the charts, and that the neighbourhood does not interact with it. As soon as the project departs from this, the lumped values become either too enveloping (caution is paid in steel and fixings) or locally insufficient (the risk is transferred to the works). CFD simulation makes it possible to go beyond these limits by incorporating:
What CFD simulation captures, and the charts ignore
- The real geometry of the building: complex shapes, setbacks, corners, atypical roofs, cantilevers, double skins.
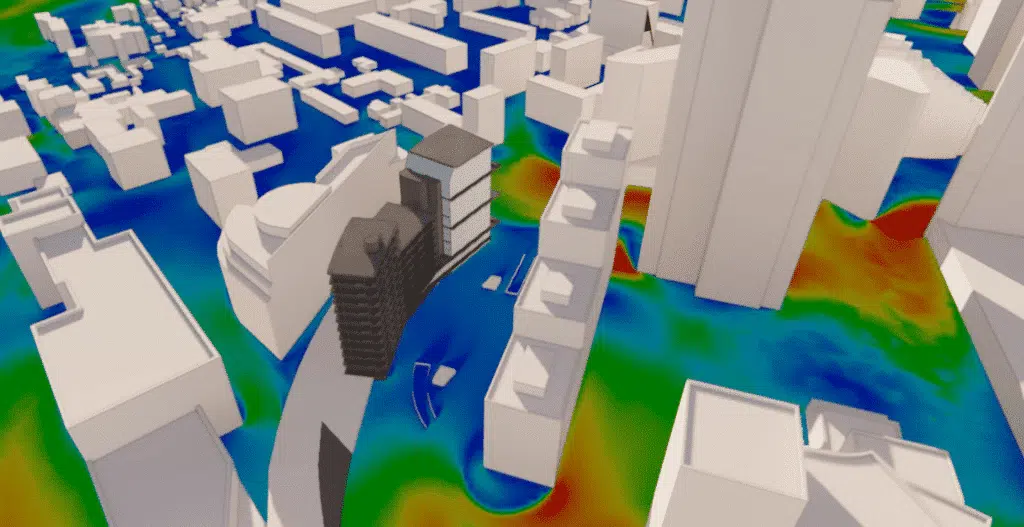
- The urban environment and site effects: neighbouring buildings, sheltering, urban canyons, Venturi effects.
- A local and directional analysis of the loads, highlighting the pressure peaks and the critical zones.
- A fine treatment of turbulence and gusts, essential for sizing the sensitive elements.
- The singular works: high-rises, stadiums, glass roofs, canopies and photovoltaic plants, textile structures, temporary works.
The Eurocode charts are established for an isolated building, sitting alone on homogeneous terrain: the surrounding buildings never enter the lumped calculation. Yet in town, it is they that make the load: sheltering, canyon overspeeds, Venturi effects, turbulent wakes. The strength of CFD simulation is precisely to integrate the calculation into the real context of the site, neighbourhood included, and to restore the interactions the standard cannot see.
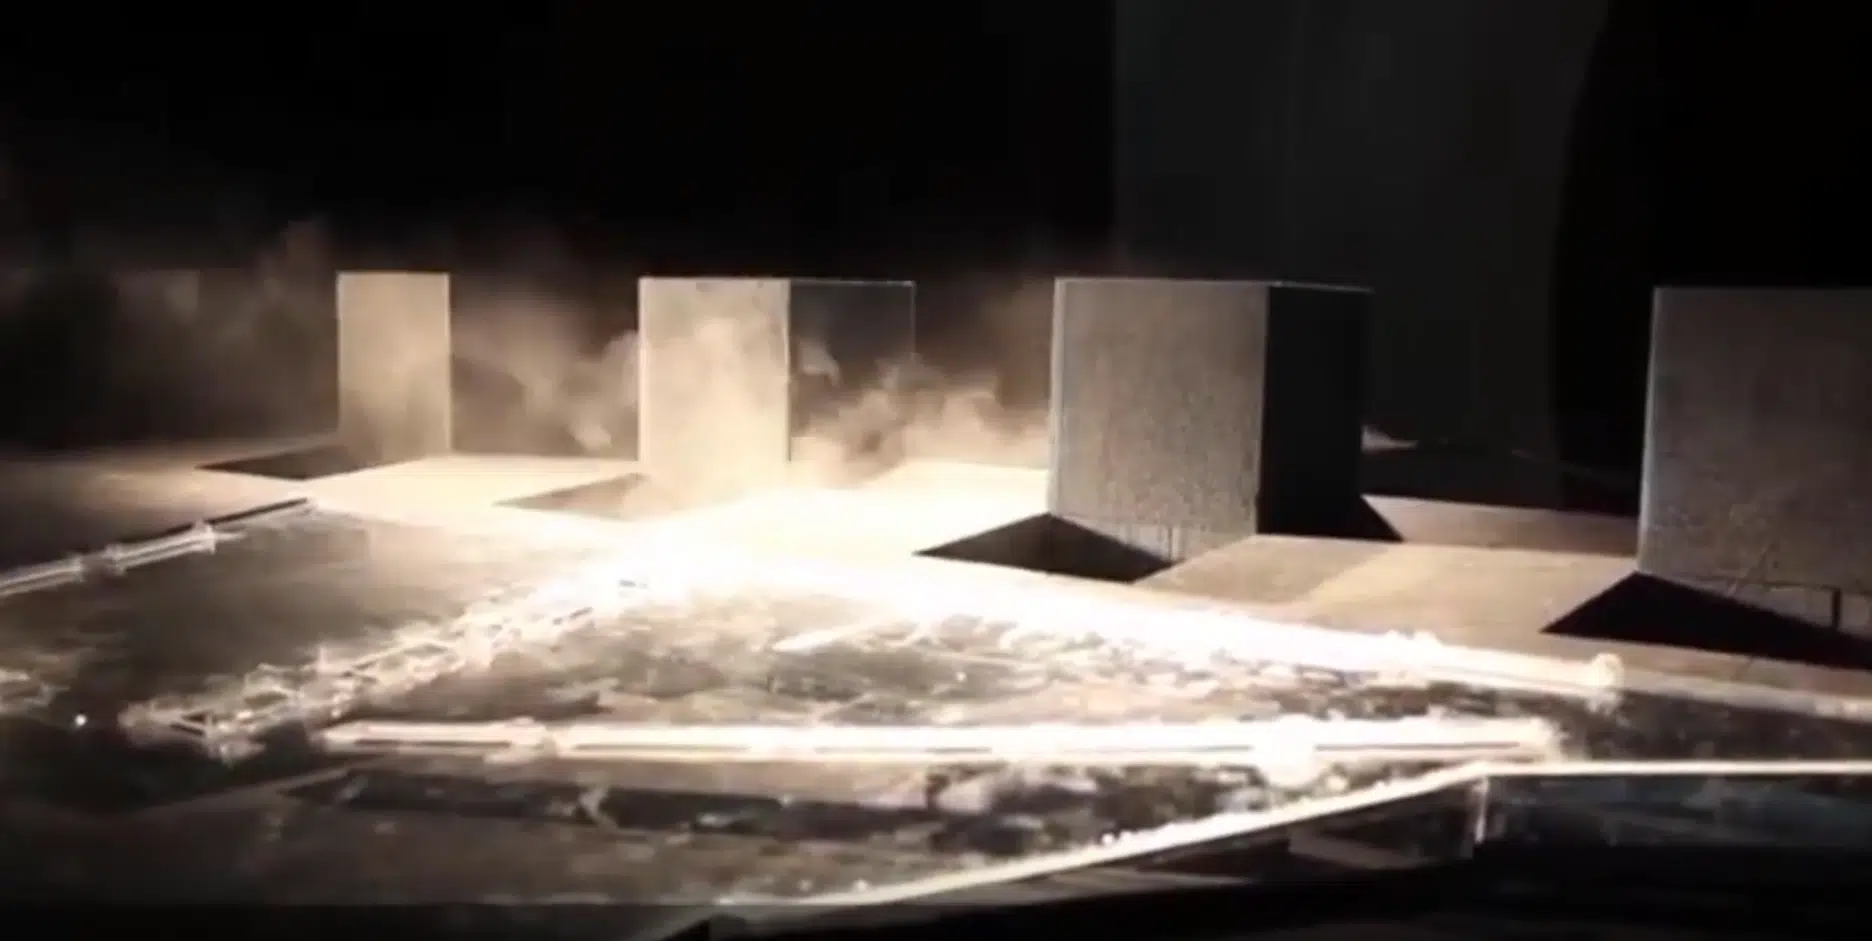
The standard itself provides for this situation: for works falling outside its domain of validity, it refers to wind-tunnel testing or to proven numerical methods. CFD then plays the role of a numerical wind tunnel: same inlet wind profiles, same output quantities, plus access to the full field at every point of the domain and the freedom to test variants without rebuilding a scale model.
Brought in early, CFD becomes a design tool
It makes it possible to compare variants (layout, massing, orientation, screens, windbreaks), to optimise the sizing of the exposed elements and to technically justify the chosen options to inspection offices and insurers. Feedback shows that this early integration significantly reduces later rework and the associated extra costs.
CFD wind simulation: the EOLIOS method
A wind-load simulation is only worth the rigour of its construction. The EOLIOS methodology follows a controlled chain in five steps: geometry, wind conditions, mesh, multi-directional computation, convergence check. Each step is documented in the study report so it can be audited by the inspection office.
3D modelling of the building and its urban environment
The study area is modelled over a perimeter large enough to guarantee the full development of the flows. The surrounding buildings are included so as to capture the sheltering, channelling and aerodynamic-interaction effects. The geometric simplifications are carried out in a controlled way: everything that structures the flow is kept (running balconies, parapets, setbacks), and what only adds numerical noise is stripped out, so as to preserve the physics while ensuring the stability of the computations.
Atmospheric boundary layer: imposing the right wind profile
Real wind is not uniform: it is structured into an atmospheric boundary layer that breaks down into three sub-layers:
- 1
The outer layer (inertial sub-layer)
A thickness of the order of a kilometre (0.5 to 3 km), where the flow gradually connects to the undisturbed wind.
- 2
The surface boundary layer
From 10 to 100 m (about 10% of the total thickness), the seat of strong velocity and temperature gradients; the wind direction stays relatively constant with height.
- 3
The roughness sub-layer
A few metres above the ground: three-dimensional, disordered flows, strongly affected by obstacles. This is the layer of pedestrians and low façades.
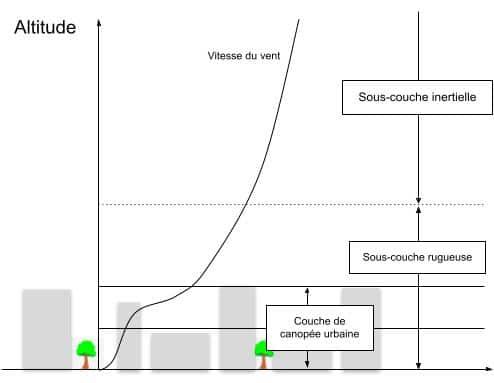
At ground level, the wind is slowed by obstacles and roughness. Higher up, in the undisturbed layers of the geostrophic wind (about 5 km), it is no longer influenced by the state of the earth's surface. Between the two, the speed varies following a logarithmic profile: this is the vertical wind shear. The profile imposed at the domain inlet is the profile of peak gust speeds, derived from the mean profile and the turbulent intensity, in strict consistency with the Eurocode:
CFD mesh: capturing the wind's pressure peaks
The mesh is refined where the extremes form: edges, corners, verges and parapets, separation and reattachment zones. Near the walls, layers of prismatic cells capture the velocity gradient; far from the building, the mesh coarsens gradually to contain the computational cost. A mesh-sensitivity study checks that the pressure coefficients no longer change as the mesh is refined: this is the condition for the extreme values to be physical results and not numerical artefacts.
Eight wind directions to identify the governing load cases
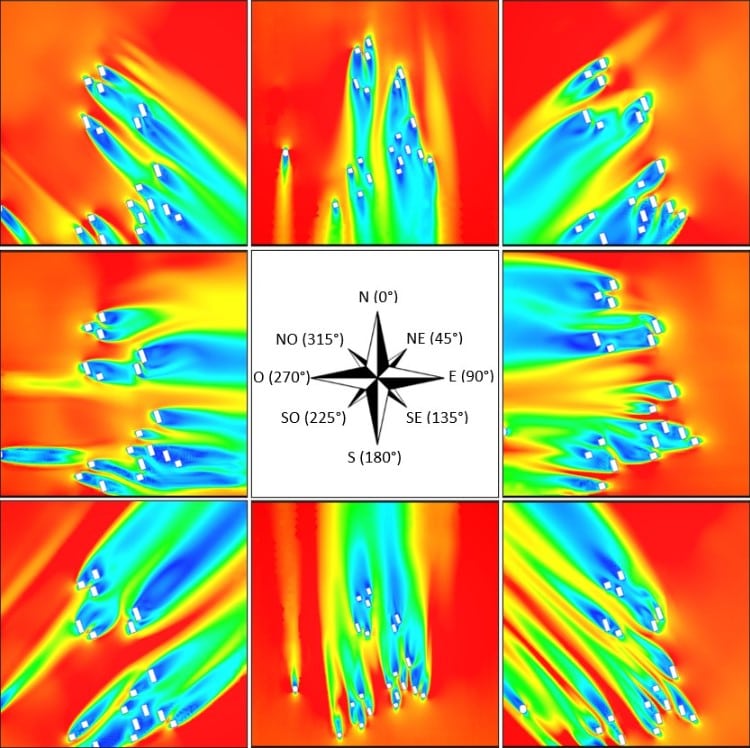
The simulations are run for the eight main directions of the wind rose, each corresponding to an extreme gust wind per Eurocode 1. This multi-case approach is essential: the direction that maximises the overall drag is almost never the one that maximises the corner suction on the roof; the 45° oblique winds are typically the most severe for tear-off, as on the panels and solar plants exposed to extreme winds, because they generate the conical roof vortices. The values of the intermediate directions (NNE, ENE, ESE…) are estimated by linear interpolation of the nearest simulated directions, and each envelope zone is finally characterised by its directional maximum.
Convergence and cross-validation, systematic
Each computation is continued until the forces integrated over the walls stabilise, and the results are compared with the analytical orders of magnitude of the Eurocode on simplified geometry. A discrepancy is explained, not merely noted: this is what makes the study defensible before an inspection office.
Pressure coefficients, tear-off: exploiting the CFD results
Flow analysis: understanding the origin of the pressure peaks
Beyond the result fields, EOLIOS's expertise lies in the physical interpretation of the flows. The simulations make it possible to pinpoint precisely the origin of the pressure peaks, to understand their mechanisms (separation, vortex/structure interaction, channelling) and to propose optimisation levers. This fine analysis holds for simple as well as complex geometries, with a three-dimensional identification of the stresses and the site effects.
From the pressure maps to the design loads
The simulation restores at every point the velocity, pressure and turbulence fields. The expertise consists in drawing from them quantities directly usable by the structural office and the façade contractor: maps of Cpe and Cpi coefficients by direction and by envelope zone, comparative directional analyses, local extreme values for the fixings, global force wrench (three forces, three moments) for the stability checks. The results are delivered in the project's zoning, not in the software's.
Tear-off check of roofs and façades
On the suction zones, the maximum local negative pressure is converted into an uplift force per element: roofing panel, waterproofing strip, individual fixing. The pressure coefficient varies with the size of the surface considered: its maximum value is Cpe,1, the coefficient for a surface below 1 m², which in practice allows the design of the small fixing elements. The maximum pressure averaged over 1 m² is written P = qp · cpe. This load is compared with the characteristic resistance of the fixing and its support (determined by testing or technical approval), factored by its partial safety coefficients. The required fixing density is deduced zone by zone:
Cross-validation: CFD simulation and analytical Eurocode 1 calculation
In order to validate the computations, the CFD outputs are systematically compared with analytical Eurocode calculations carried out on greatly simplified geometries, which provide an order of magnitude of the pressures. The estimate couples the peak dynamic pressure with the standard pressure coefficients of the charts. For a tower of height h and base b satisfying h > 2b, the standard takes qp(z) = qp(h) for h − b < z < h; it follows, for z > h − b:
This double reading, numerical and normative, guarantees that no result is used without being bounded by the standard. The study deliverables split between the structure and the envelope:
Deliverables for the structure
- The overall force wrench (forces and moments) for the stability checks and the bracing.
- The comparative directional analyses and the synthetic load cases per zone, directly injectable into the structural model.
- An auditable report: assumptions, wind profiles, mesh, convergence, analytical comparison.
Deliverables for the envelope
- The pressure and Cpe/Cpi coefficient maps by wind direction, over the whole envelope.
- The identification of the critical zones and the tear-off check of the envelope elements.
- Design recommendations: parapet geometry, corner treatment, fixing densities, compared variants.
A CFD wind study serving well-controlled projects
Who is the wind study for?
The EOLIOS wind study fits into the project's design chain and speaks to each of its stakeholders in their own language:
| Project stakeholder | What the study brings them |
|---|---|
| Owners & developers | Secure the project, prevent wind claims and objectify the dialogue with insurers. |
| Architects | Arbitrate massing, orientation and corner treatment early, on figures rather than intuition. |
| Structural engineering offices | Load cases and a force wrench directly injectable into the calculation model. |
| Façade, roofing, waterproofing contractors | Fixings sized to the nearest, zone by zone, with the tear-off check. |
| Inspection offices & insurers | An auditable report, bounded by the Eurocode 1 framework. |
Why complement Eurocode 1 with a CFD wind study?
Eurocode 1 remains the regulatory foundation: it sets the reference speed, the wind profile, the safety coefficients, and guarantees compliance. CFD does not replace it, it extends it where its idealised geometries reach their limits: where the lumped calculation considers an isolated building, the simulation places the project back in the real context of the site and restores the real distribution of the forces, neighbourhood, sheltering and interactions included.
By combining a fine command of the regulatory requirements, advanced CFD expertise and an ability to physically interpret the results, EOLIOS supports its clients in securing and optimising their projects against wind-related risks: securing the suction zones before they become claims, sizing the structure and the fixings to the nearest rather than to the most enveloping, and justifying every assumption. CFD thus becomes a strategic tool for risk reduction, technical justification and economic control, in the service of safe, durable and high-performing buildings. A wind study conducted within the framework of Eurocode 1, from the peak-pressure calculation to the tear-off check.