
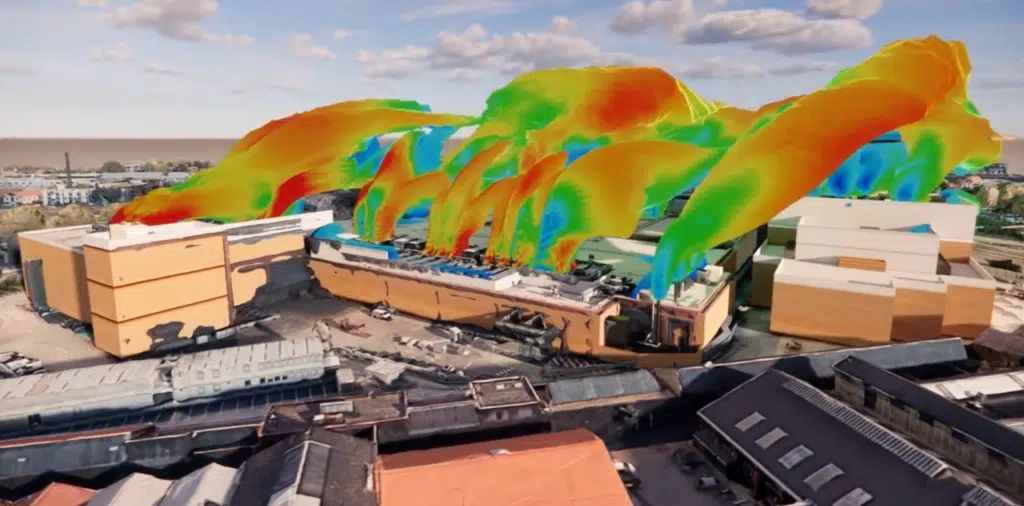
Why carry out an external CFD simulation?
External CFD simulation for data centers is an expertise EOLIOS masters end to end: more than 350 data centers studied across 20 countries, from hyperscale campus to the most constrained urban site. Our methods, backed by real-condition measurement campaigns, are an international benchmark.
A data center can line up generous cooling power and N+2 redundancy, and still lose capacity at the worst moment. The reason is simple: the power actually available in the halls depends on the temperature of the air the outdoor equipment draws in. When that air has been pre-heated by the exhaust of neighbouring machines, performance drops, precisely when demand is at its peak. This risk shows on no drawing: only CFD simulation makes it visible before it costs megawatts.
What an external CFD simulation secures
Diagnosis
- Study of the thermal plumes
- Real inlet temperature of each piece of equipment
- Quantification of hot-air recirculation
Analysis
- Critical failure scenarios
- Heatwave, adverse wind, transients
- Impact of the generators
Design
- Validation of the layout
- Cowlings, screens & over-roofs tested
- A validated solution, not just a finding
A twin of the site and its environment
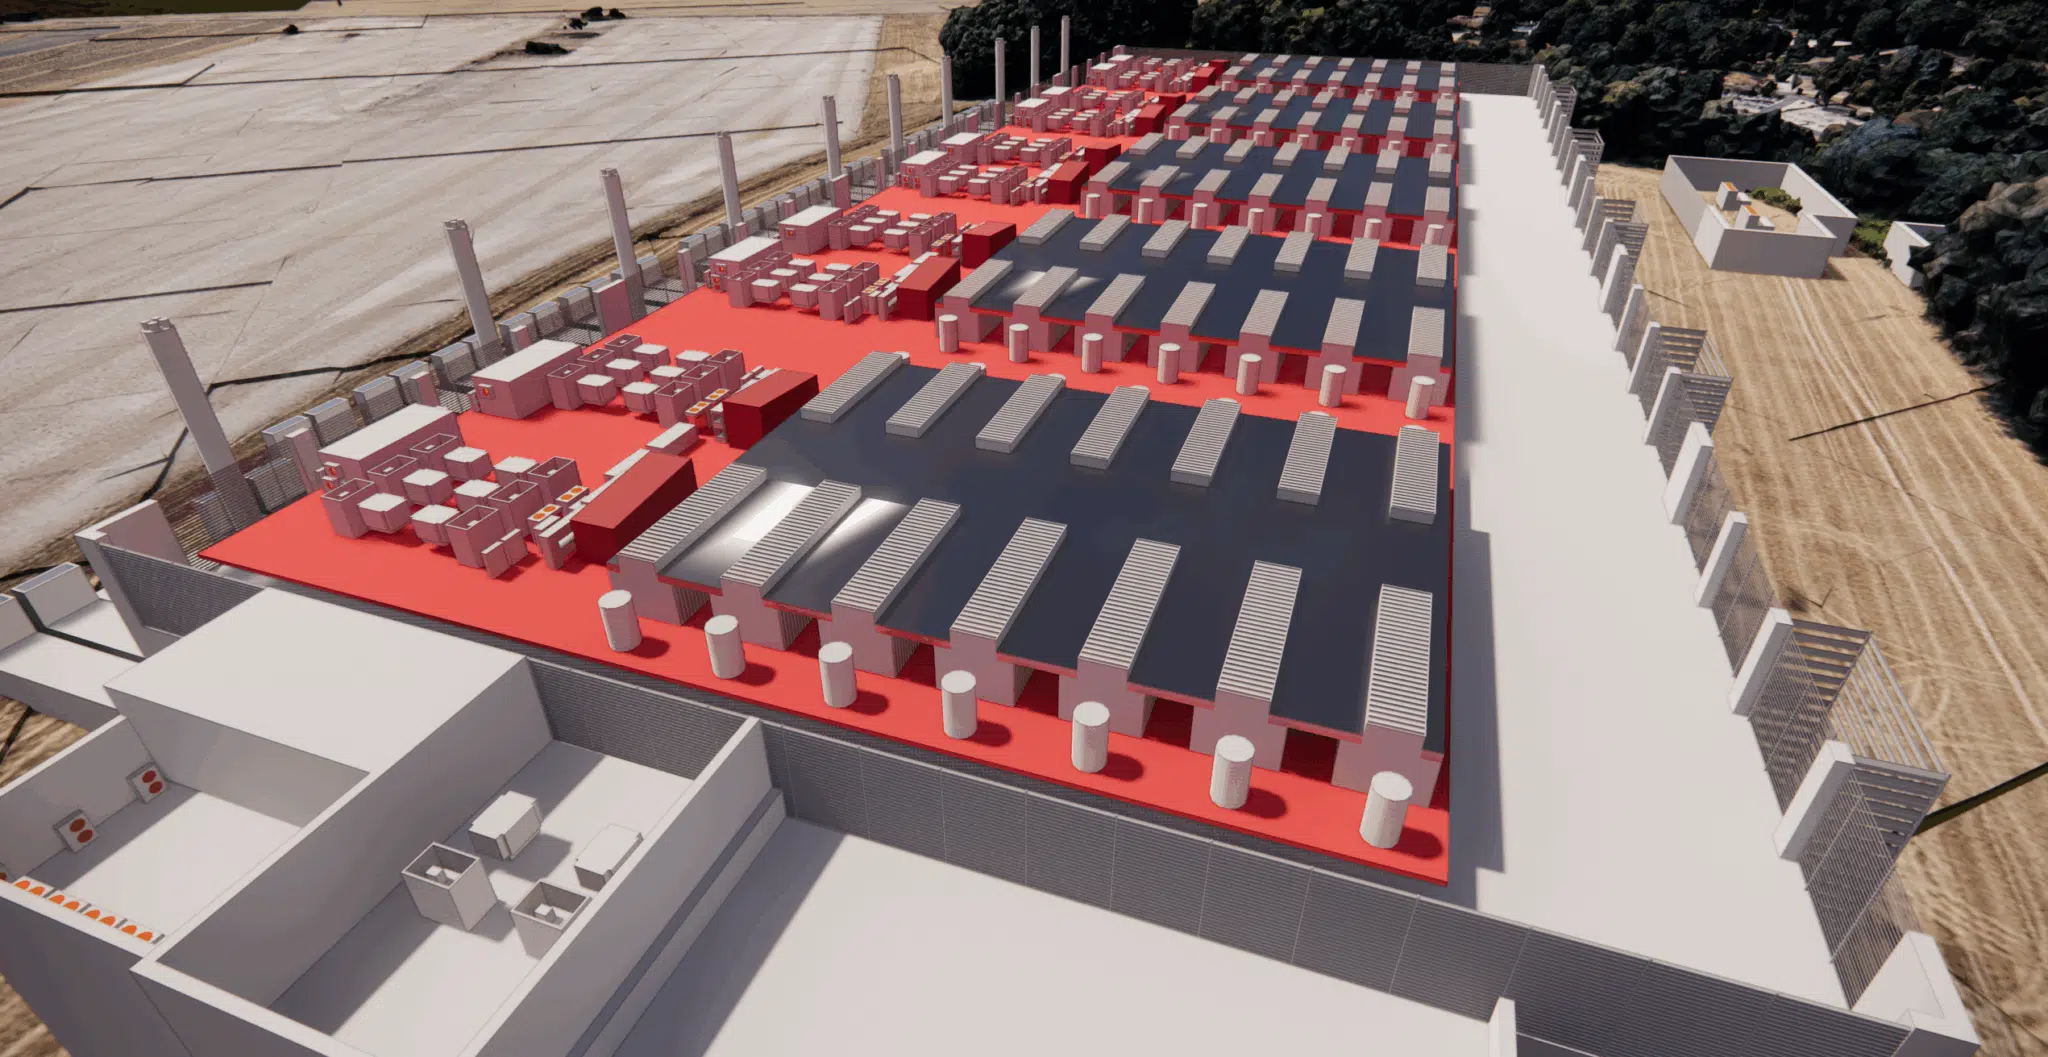
We build a complete digital model of the site: the surrounding buildings, every cooling device on the roof and on the façades, the exhausts, the fresh-air intakes and the details that shape the real flow (windbreaks, louvres, blades, parapets, cowlings). This model reproduces the air flow rate, temperature and humidity at every point, for each operating mode (normal, maintenance, emergency) and each weather condition (temperature, wind speed and direction).
The capacity of your halls is decided on the roof
A dry cooler selected for 35 °C air that draws in recirculated air at 47 °C immediately derates. In cascade, it is the halls that lose their cooling capacity, without any single piece of equipment failing.
The outdoor airflow of a data center
In the yard or on the roof, the mechanical heat-rejection systems, cooling towers, dry coolers (DRY) and chillers, share a constrained surface with the backup generators. The density of the cabinets inside imposes an equivalent density of equipment outside: each machine rejects a hot plume a few metres from the intakes of its neighbours.
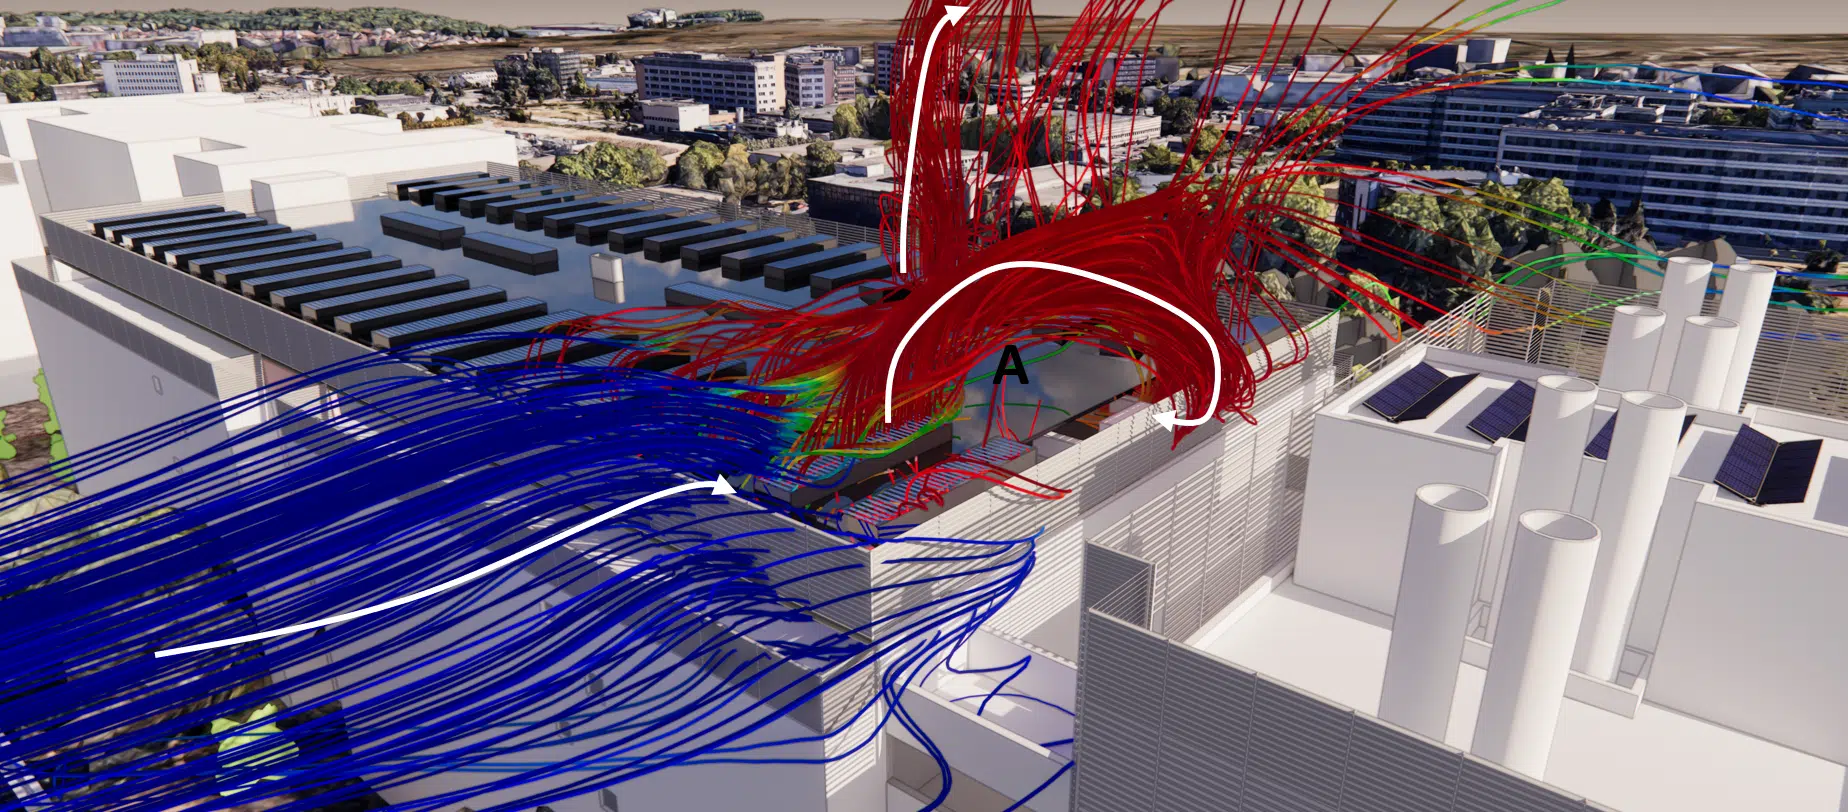
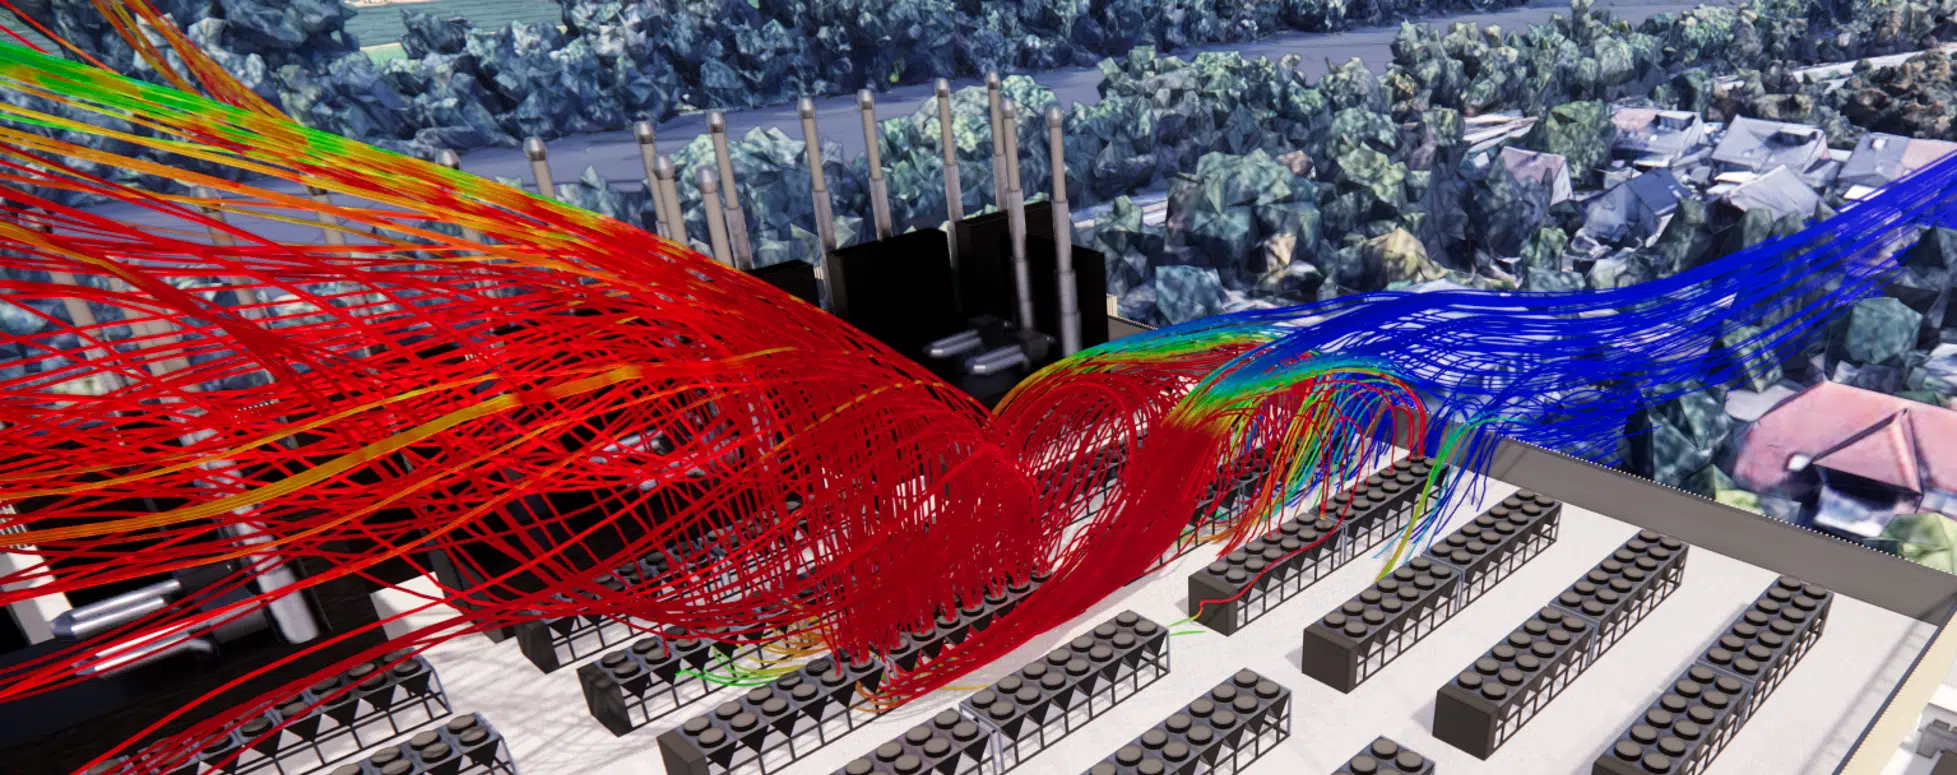
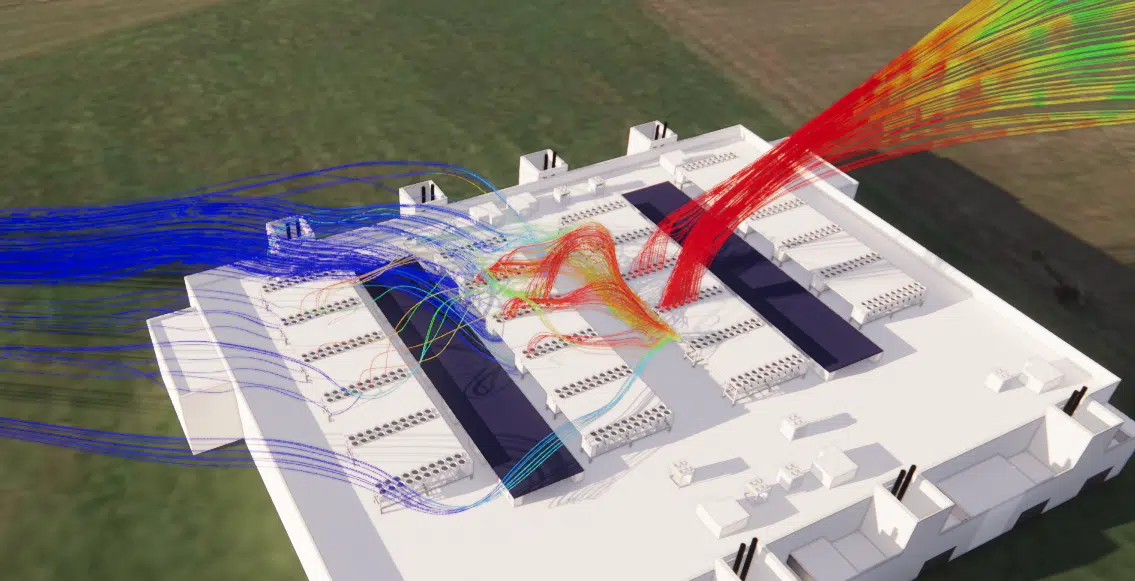
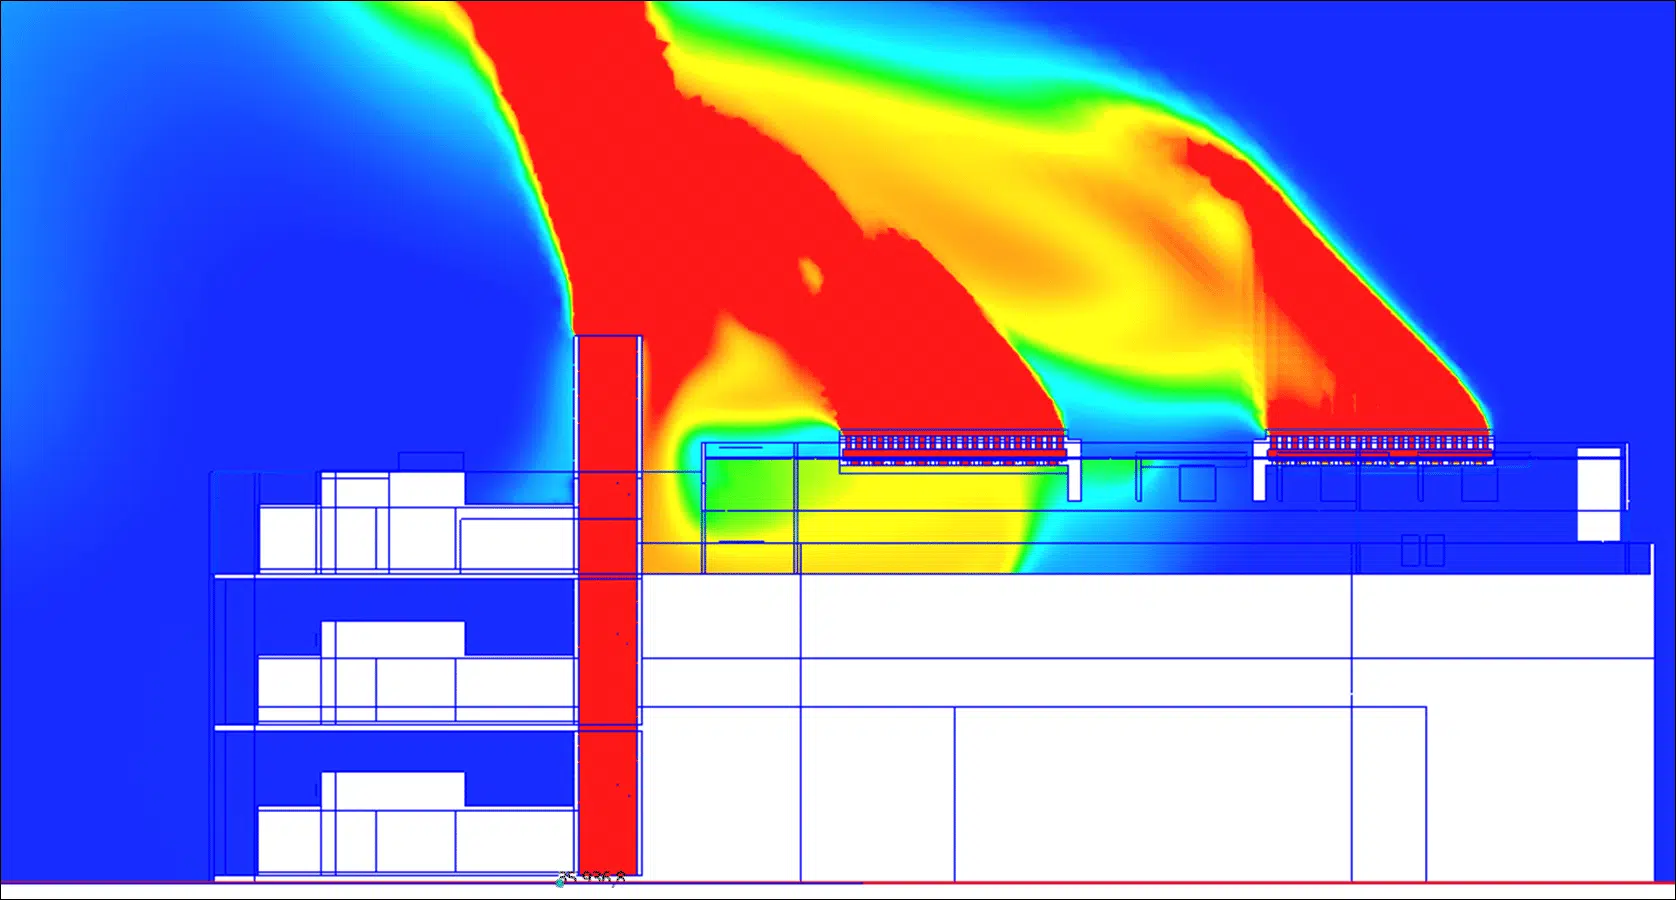
A column of hot air, less dense than the ambient air, that rises above a rejection point. Without wind, it climbs and dilutes. With wind, it lies down, stretches and can be pushed back towards the intakes located under its path.
Influence of wind and weather
The behaviour of the plumes depends on variables the designers do not control: wind speed and direction, air temperature and humidity, rejections from neighbouring activities. These phenomena have a direct impact on the performance of the outdoor equipment, and they change from one hour to the next. The point is not to predict the weather, but to verify that the site stays within its operating range for every plausible adverse combination.
Hot-air recirculation and thermal short-circuits
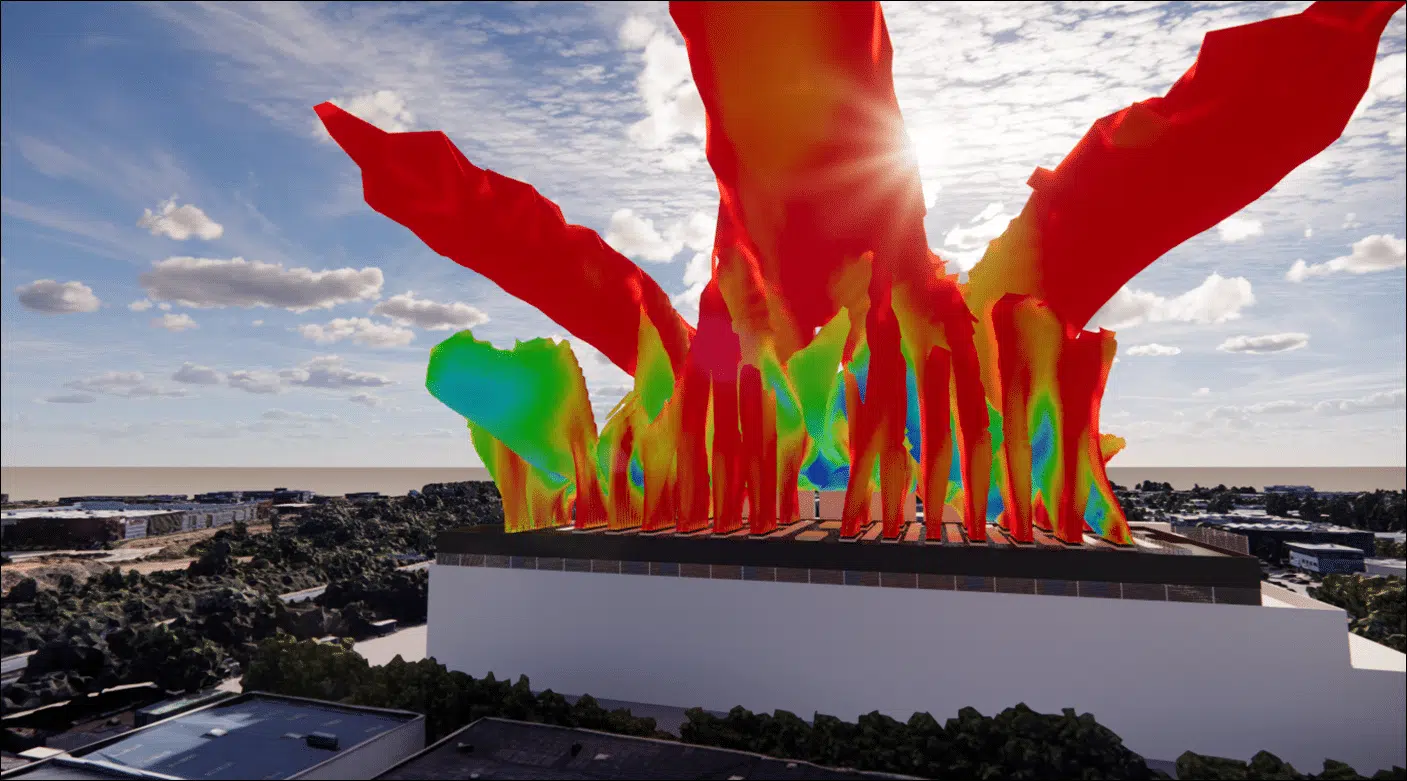
Hot-air recirculation is the central mechanism that external CFD quantifies. It takes four forms, often combined on the same site:
Four mechanisms to track down
- Self-recirculation. A piece of equipment re-ingests its own exhaust, pushed back by the wind or trapped by a parapet.
- Cross short-circuit. The plume of one machine feeds the intake of its neighbour; the heating spreads step by step until a cascading trip.
- Wake effect. A rooftop structure, a screen or a neighbouring building creates a recirculation zone that traps hot air at the intakes.
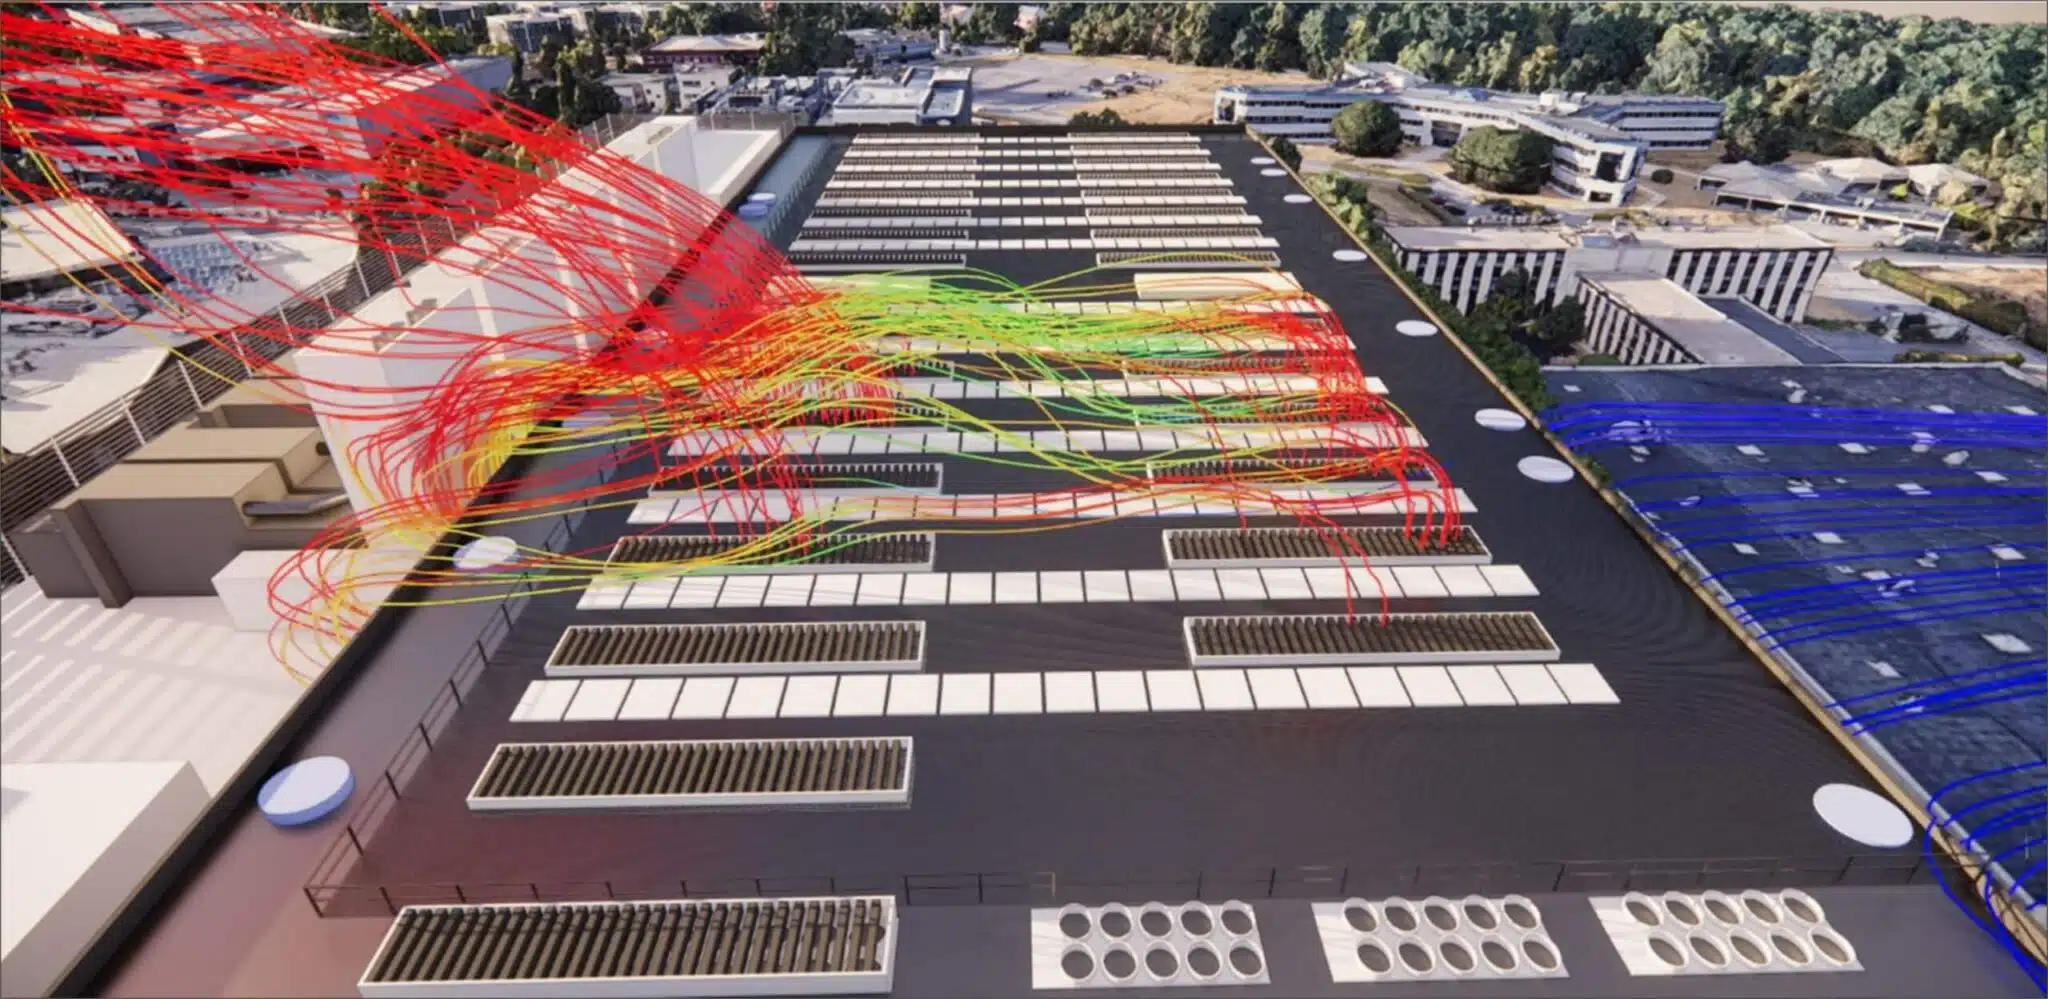
- Campus build-up. At the scale of a multi-building site, the rejections of one data center pre-heat the intake air of the next, depending on wind direction.
Why manufacturer clearances are not enough
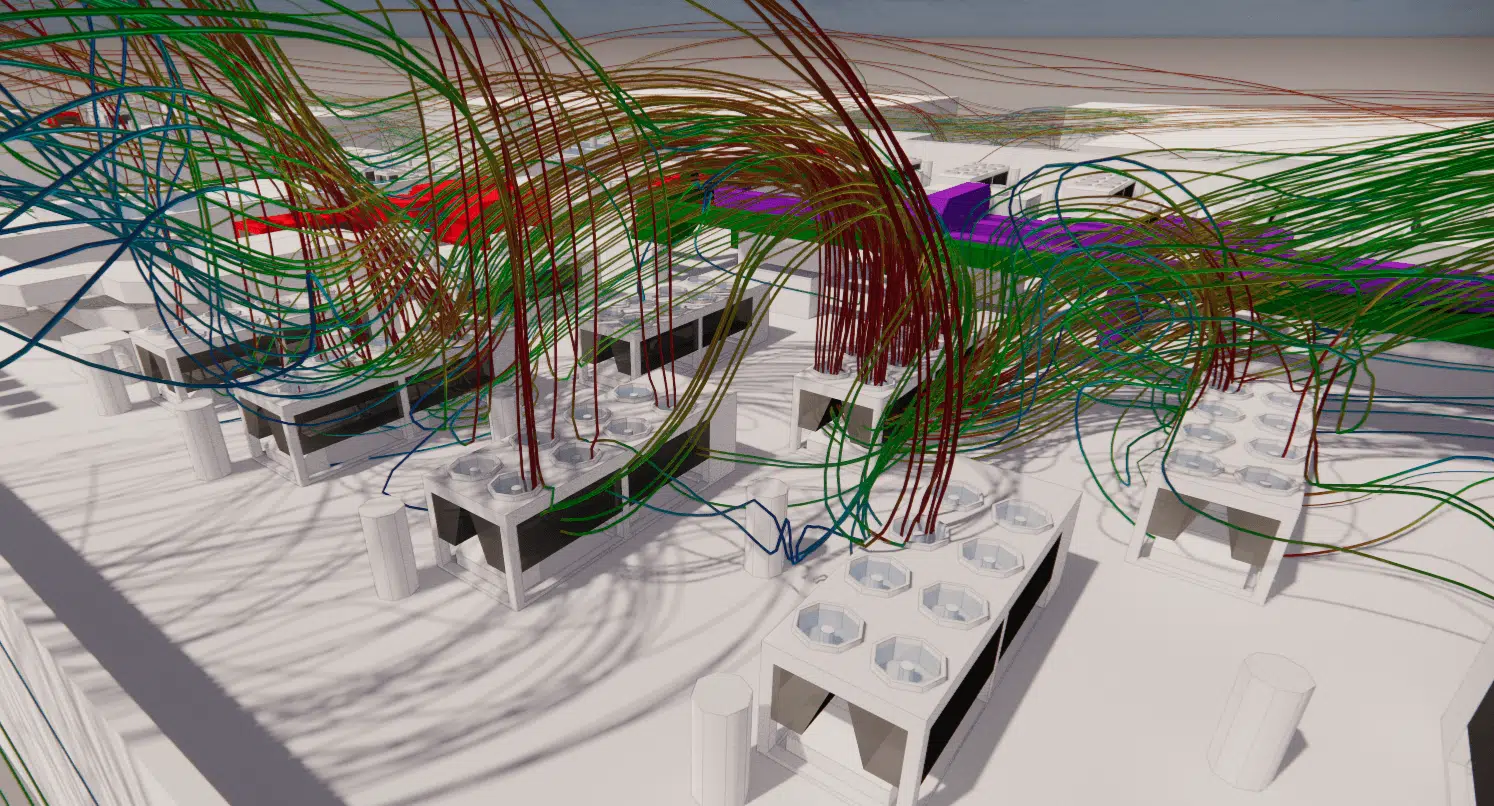
Manufacturer documents provide minimum clearances and a maximum operating temperature. These flat-rate rules ignore the wind, the built environment and the interaction between machines: a layout perfectly compliant with the datasheets can produce severe recirculation, which only simulation reveals. The placement of the cooling systems is validated in the real flow, not in a catalogue.
“Is your data center protected against the failure of its cooling systems during a heatwave?”
At the scale of a campus or a district dense with digital infrastructure, the hot rejections of one data center become the intake air of its neighbour. This cross thermal pollution, invisible on the drawings of each site taken in isolation, can remove several degrees of margin from a data center that is otherwise well designed. We quantify it by modelling all the buildings and their equipment, including those of the neighbouring sites.
Extreme conditions: the scenarios that size the design
A serious study does not stop at the nominal regime in calm weather. The calculation conditions are built from a meteorological analysis of the site (ASHRAE data from the nearest station, wind statistics), validated with the client before any modelling: extreme temperature with a 50-year return period, dominant wind directions with their coincident median speed. The cases are simulated with the site at 90 % IT load, generators and cooling systems operated according to the real operating sequence. Each scenario answers a specific design or operating question.
The canonical scenarios of an external CFD
The validation criterion
The validation criterion is unambiguous: each critical piece of equipment must sustain the IT load continuously in all simulated cases, without exceeding its inlet temperature limit. When a mitigation is required, it is modelled then re-tested in the most adverse wind conditions to quantify its real gain.
Transients: the minutes that count
The transient scenarios track the evolution minute by minute: the rise of the plumes at the simultaneous start of the generators, the switching of cooling modes, the return to nominal. It is in these short phases that the temperature overshoots concentrate, invisible in a steady-state calculation.
Generators: hot plumes and NOx emissions
The generators concentrate two distinct risks. The first is thermal: their exhausts and their radiators reject, during periodic tests as well as in backup, very hot plumes that can saturate the intakes of the cooling systems at the very moment the site is running in degraded mode.
The second is health-related and regulatory: the combustion flue gases loaded with nitrogen oxides (NOx) must not be drawn back in by the office air handling units, nor by the fresh-air intakes, nor pushed back towards the neighbourhood. The simulation checks the dispersion of the emissions for each wind direction and guides the stack height, orientation and exhaust velocity, consistent with the pressure losses of the generator networks.
Compliance. The concentrations at the fresh-air intakes and at the openings of occupied premises are compared with the applicable limit values (local regulation and client requirements); the report documents each control point, wind direction by wind direction.
Simulating the monthly tests too
The periodic tests are a scenario in their own right: every month, the generators start while the site is running normally. The simulation checks that, for the adverse wind directions, these tests degrade neither the performance of the dry coolers nor the air quality at the fresh-air intakes, and where relevant makes it possible to adapt the window or the sequence of the tests.
Heat island and urban integration
A data center is a permanent heat source in its district. At the urban scale, CFD characterises the dispersion of the plumes according to the equipment configuration, the morphology of the built environment, the materials and the real weather, and quantifies the temperature rise induced at the level of the residents. This analysis is the subject of a dedicated expertise: the urban heat-island impact study for data centers.
It feeds the impact studies and the discussions with local authorities: comparison of siting variants, vegetation screens, variable-speed dry coolers, waste-heat recovery. It documents objectively what the project changes, and what it does not change.
The EOLIOS method: from the 3D model to the quantified verdict
The value of an external CFD lies in the fidelity of the model and the relevance of the scenarios. Our 3D model integrates the complete site: topography, surrounding buildings, façades with their louvres, parapets and rooftop structures, each piece of equipment with its real flow curves and rejection temperatures, validated by the manufacturer data. The obstacles to the airflow (walls, parapets, screens) are modelled with their documented free surface, and the buildings delivered in phases are simulated in their complete configuration.
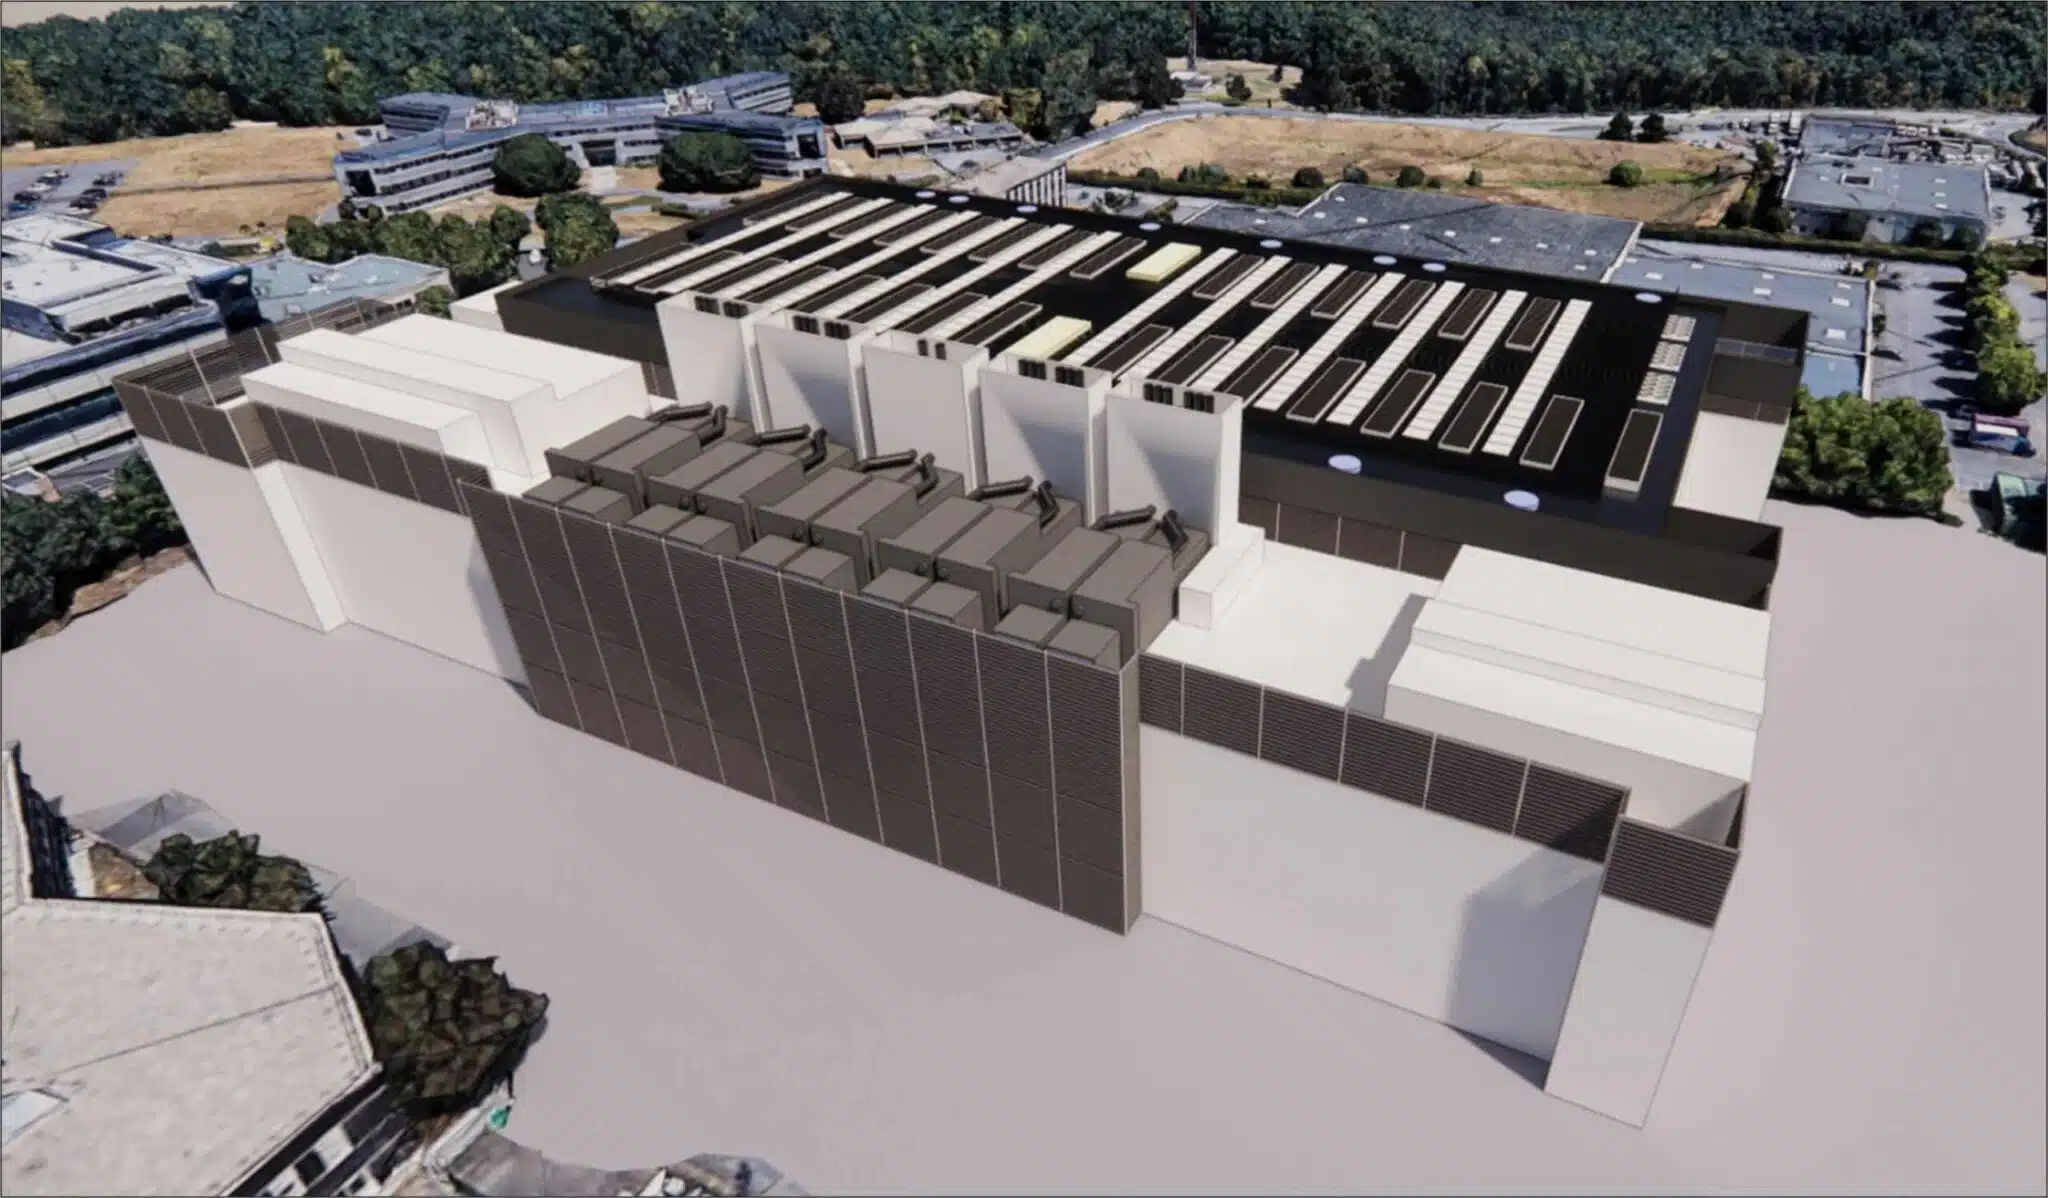
The course of a study
- Collection. Drawings, equipment datasheets, operating regimes, site climate data.
- 3D modelling. Site, surrounding buildings, equipment and airflow details, with a mesh refined around the rejections and the intakes.
- Scenarios. Nominal, heatwave, adverse winds, maintenance and backup, in steady state as well as transient.
- Analysis and recommendations. Maps, quantification of the recirculation, solutions tested in the same model.
Our studies natively meet the CFD specifications of hyperscale and colocation operators: imposed scenarios, validation criteria, minimum report contents. And because a project cannot wait: our dedicated computing power lets us deliver emergency simulations, with first results within a few days when the client need requires it.
Compliant with the CFD standards of the hyperscalers
- Prior weather analysis submitted for validation before modelling (nearest station, N = 50 yr extremes).
- Velocity, temperature and pressure planes in horizontal and vertical sections, at mid-height and at the top of each critical piece of equipment.
- Thermal streamlines from each exhaust, velocity vectors locating depressions, back-pressures and recirculation.
- Heating and derating table per critical piece of equipment at the most adverse scenario, temperatures of all the air intakes of the building, mitigation re-simulated at the worst wind.
Frankfurt: a recirculation detected before construction
Three scenarios simulated (no wind, adverse wind in N regime, adverse wind in critical N+X regime) on a site with 26 generators: a recirculation at the south-west louvres, caused by the partial obstruction of the extraction ducts, was identified then corrected upstream. See the project.
The verdict is quantified equipment by equipment: inlet temperature compared with the manufacturer limit, heating attributable to recirculation, capacity loss per scenario. When a risk appears, the corrective solutions are tested directly in the model: cowlings and over-roofs, screens, raised exhausts, machine reorientation, speed sequencing. We do not deliver a problem, we deliver the validated solution.
From temperature to available cooling power
The mapping is not an end in itself: it translates into power. For each dry cooler, DRY or chiller, the computed inlet temperature is crossed with the manufacturer's performance curve to obtain the cooling power actually deliverable in the studied scenario. Aggregating over all the equipment gives the drop in the site's available cooling power, scenario by scenario, compared with the IT demand: we know which machines derate, by how much, and what margin remains before losing halls.
PUE: an energy reserve rarely identified
Hot-air recirculation does not only threaten availability: it weighs on the electricity bill all year round. A heating of 3 to 5 °C at the intake of the drys and the chillers degrades their COP, on the order of 2 to 3 % per additional degree: between 42 and 47 °C of intake air, that is 10 to 15 % of efficiency lost, and each piece of equipment consumes more to deliver the same cooling, hour after hour, including outside a heatwave. At the scale of a data center, where cooling accounts for 30 to 40 % of the electricity consumption, this silent extra cost can represent on the order of 4 to 7 % of the site consumption, a PUE drift that few operators know how to attribute to the outdoor airflow. Correcting the layout or cowling the equipment then becomes a direct lever for energy optimization and PUE.
Adiabatic cooling: humidity enters the calculation
Evaporative cooling is not limited to wet media and misting: the cooling towers and the adiabatic drys exploit the same principle, and their efficiency is bounded by the wet-bulb temperature of the intake air, not only by its dry-bulb temperature. Our model therefore also transports humidity, treated as a mass fraction of water vapour with its effect on the buoyancy of the plumes: the humid rejections, recirculated towards the neighbouring intakes, raise the local wet-bulb temperature and eat precisely into the expected cooling potential. The simulation computes the humidity field around the site, checks the real approach of each piece of equipment in adiabatic mode and secures the sizing, right down to the associated water consumption. The specifics of cooling towers (plumes, ICPE regulation) are the subject of a dedicated dossier.
What we deliver
- 3D maps of temperature and velocity over the roof and the surroundings, per scenario.
- Compliance table per equipment: inlet temperature compared with the manufacturer limit.
- Quantification of the recirculation and the associated capacity losses.
- Available cooling power curve per scenario, crossing inlet temperatures and manufacturer curves.
- Concentrations of pollutants (NOx) at the air intakes, compared with the applicable limits.
- Prioritised layout recommendations, already tested in the model.
Engineers embedded in your design teams
EOLIOS is a consultancy of engineers specialised in the thermal and airflow design of data centers. External CFD is not, for us, an isolated deliverable: it is a design tool, in the service of a validated layout.
A short loop, from sketch to execution
We work within the design teams, alongside the architects, the HVAC engineering firms, the builders and the operators. From the sketch stage, we steer the equipment layout and the façade choices; at preliminary-design stage, each variant is arbitrated on simulation results rather than flat-rate rules; at execution, the final design is validated in its extreme conditions. This short loop avoids late changes, the most costly ones.
Campus organisation and equipment layout steered by simulation from the sketch stage.
The strongest leverSiting variants arbitrated on CFD results, not on flat-rate rules.
Variants comparedFinal design validated in its extreme conditions: heatwave, adverse wind, backup.
ValidationAudit, diagnostics and resolution of the thermal issues of sites in operation.
Audit & resolutionFrom external CFD to the digital twin
The external study articulates with the internal CFD simulation of the server rooms: the inlet temperature of the dry coolers directly conditions the capacity available in the halls. It extends into commissioning then into operation via the site's digital twin.
What we bring to the design team
- Answers at the pace of the project. Siting variants arbitrated within a few days, not at the end of the phase.
- A common language. 3D images and animations readable by the investor, the architect and the operator.
- Objectified margins. Redundancy and extreme conditions validated by calculation, documented for the availability commitments.
- Continuity. The same model serves from the sketch to the digital twin of operation.